Squarespace Analytics empowers customers with data insights to help them make better decisions & grow their business. Traffic Alerts uses machine learning to detect important changes in traffic, probe where visitors are coming from and where they’re going, and send notifications so users can best prepare for what’s to come.
Role
Product Designer
Timeline
March - July 2018
Context
We want to help users spend less time interpreting graphs and charts by pulling together relevant pieces of analytics data to tell a whole story. This is our first step into becoming a more diagnostic and predictive analytics.
Hypothesis
By surfacing notable spikes and dips to users, we will see an increase in engagement with analytics (currently only 30% MAU use analytics tools) and encourage making business decisions with data, rather than just intuition.
Research & Validation
Analytics App users have been asking for push notifications for notable moments
Analytics users have asked for daily and weekly push notifications to aggregate traffic and sales “reports” and be filled in on significant site activity instead of discovering this information retroactively.
We have the data readily available to surface unique and actionable insights
In a related study with commerce basic and advanced users who are not MAU, we learned that users find data reassuring, but perplexing, as they struggled to piece together insights and business strategy.
Customers like Pack Up + Go missed out on high visibility traffic and revenue
In high traffic moments, small business owners “go into overdrive” to secure and manage various orders and logistics, as we learned in Lunch n’ Learns. With prompt alerts, customers could have better prepared for these opportunities.
Anomaly Detection Beta and Usability Testing
We released the invite-only beta to 22 Squarespace customers who had requested notifications via the Analytics App and met with five customers based in NYC to measure value and usability.
Traffic alerts aren’t as valuable when they’ve taken the steps to make it happen
Traffic alerts and chart annotations are more valuable if due to an organic event. If marketing efforts were intentionally put into making the spike happen, traffic spikes are perceived to be noisy.
Visits from Direct is confusing and isn’t so actionable, along with % change metrics
The Direct category seemed to be mysterious, as it’s a catch-all for direct visitors as well as other unidentifiable site visitors and bots. Our platform team can begin investigations into capturing Direct more accurately.
Mixed responses towards Expected Range
Most participants responded to the expected range graph with confusion. Users who are well versed in their own site traffic even made the point to say that their expected range weren’t accurate.
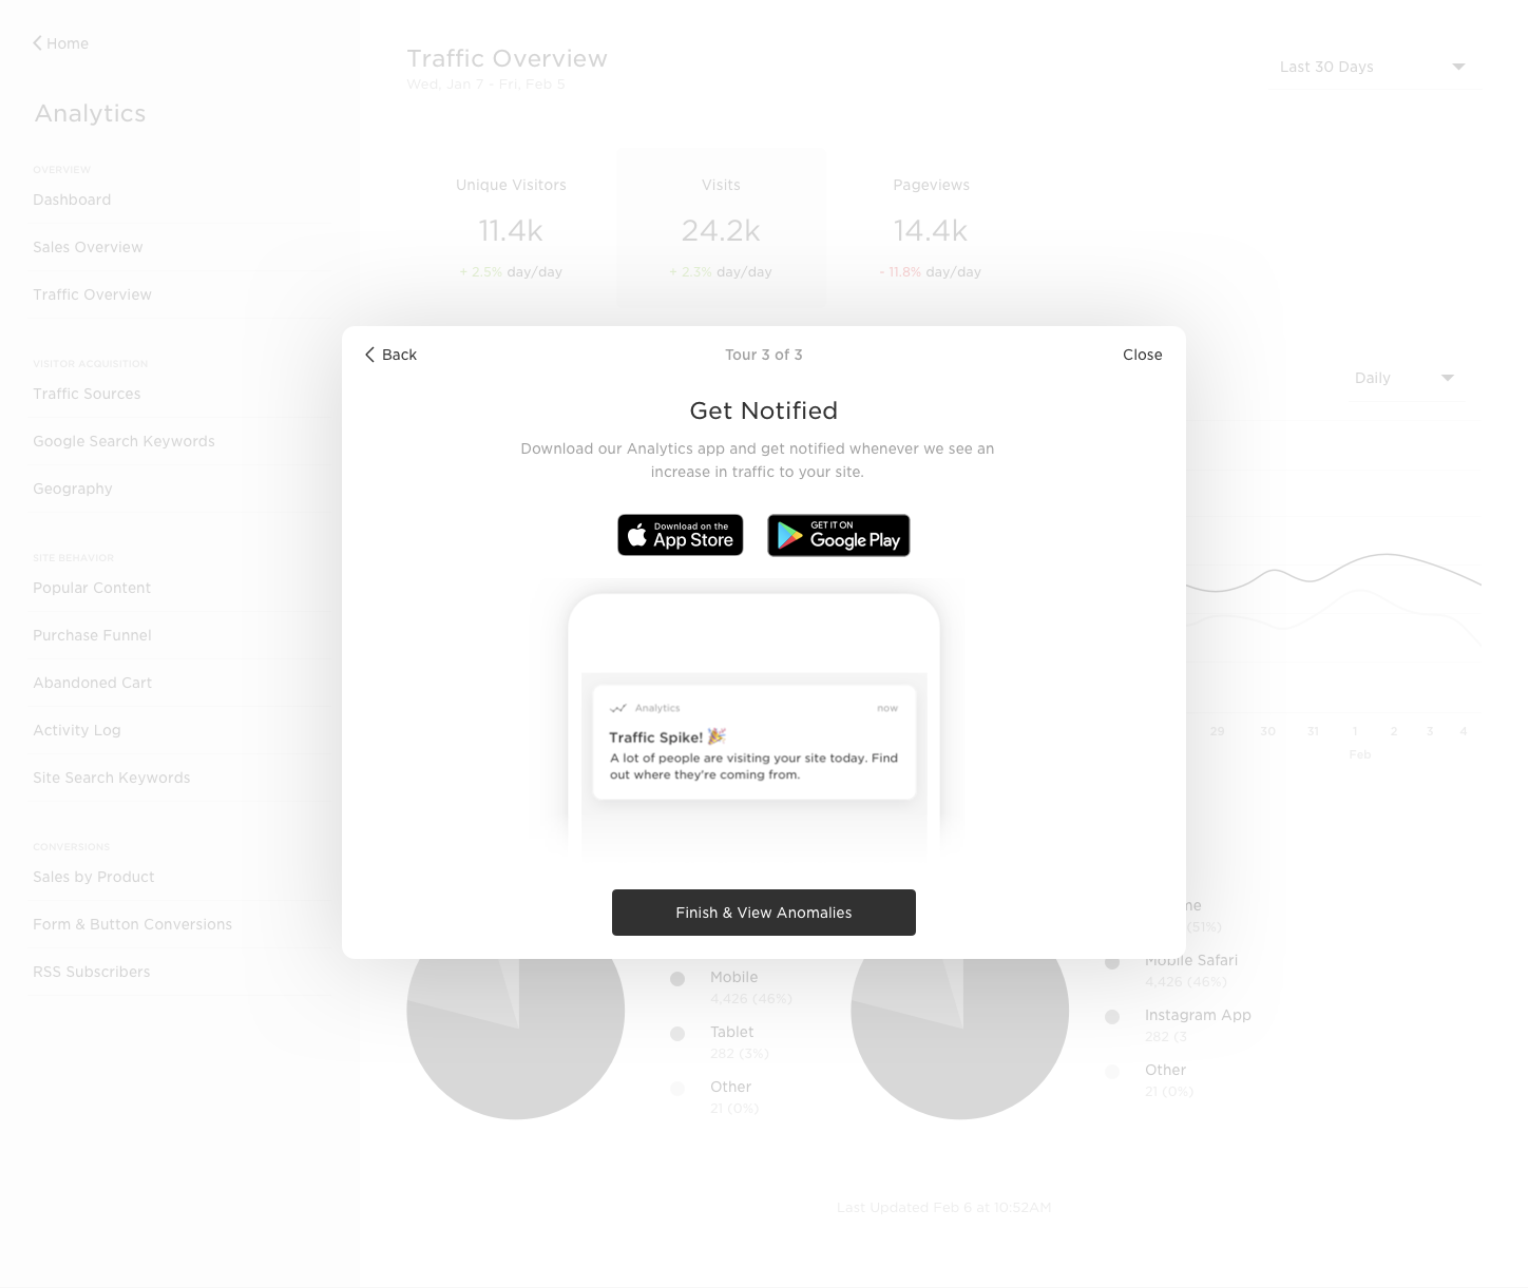
Onboarding
Contextual introduction
This short onboarding modal appears to educate users on the feature, its value, and limitations.
How it works
After clicking the traffic alerts icon, users can discover top pages and top drivers of traffic.
Get the app
Learning about a traffic alert is the most useful when it’s actually happening, so the last step is a plug to our apps.
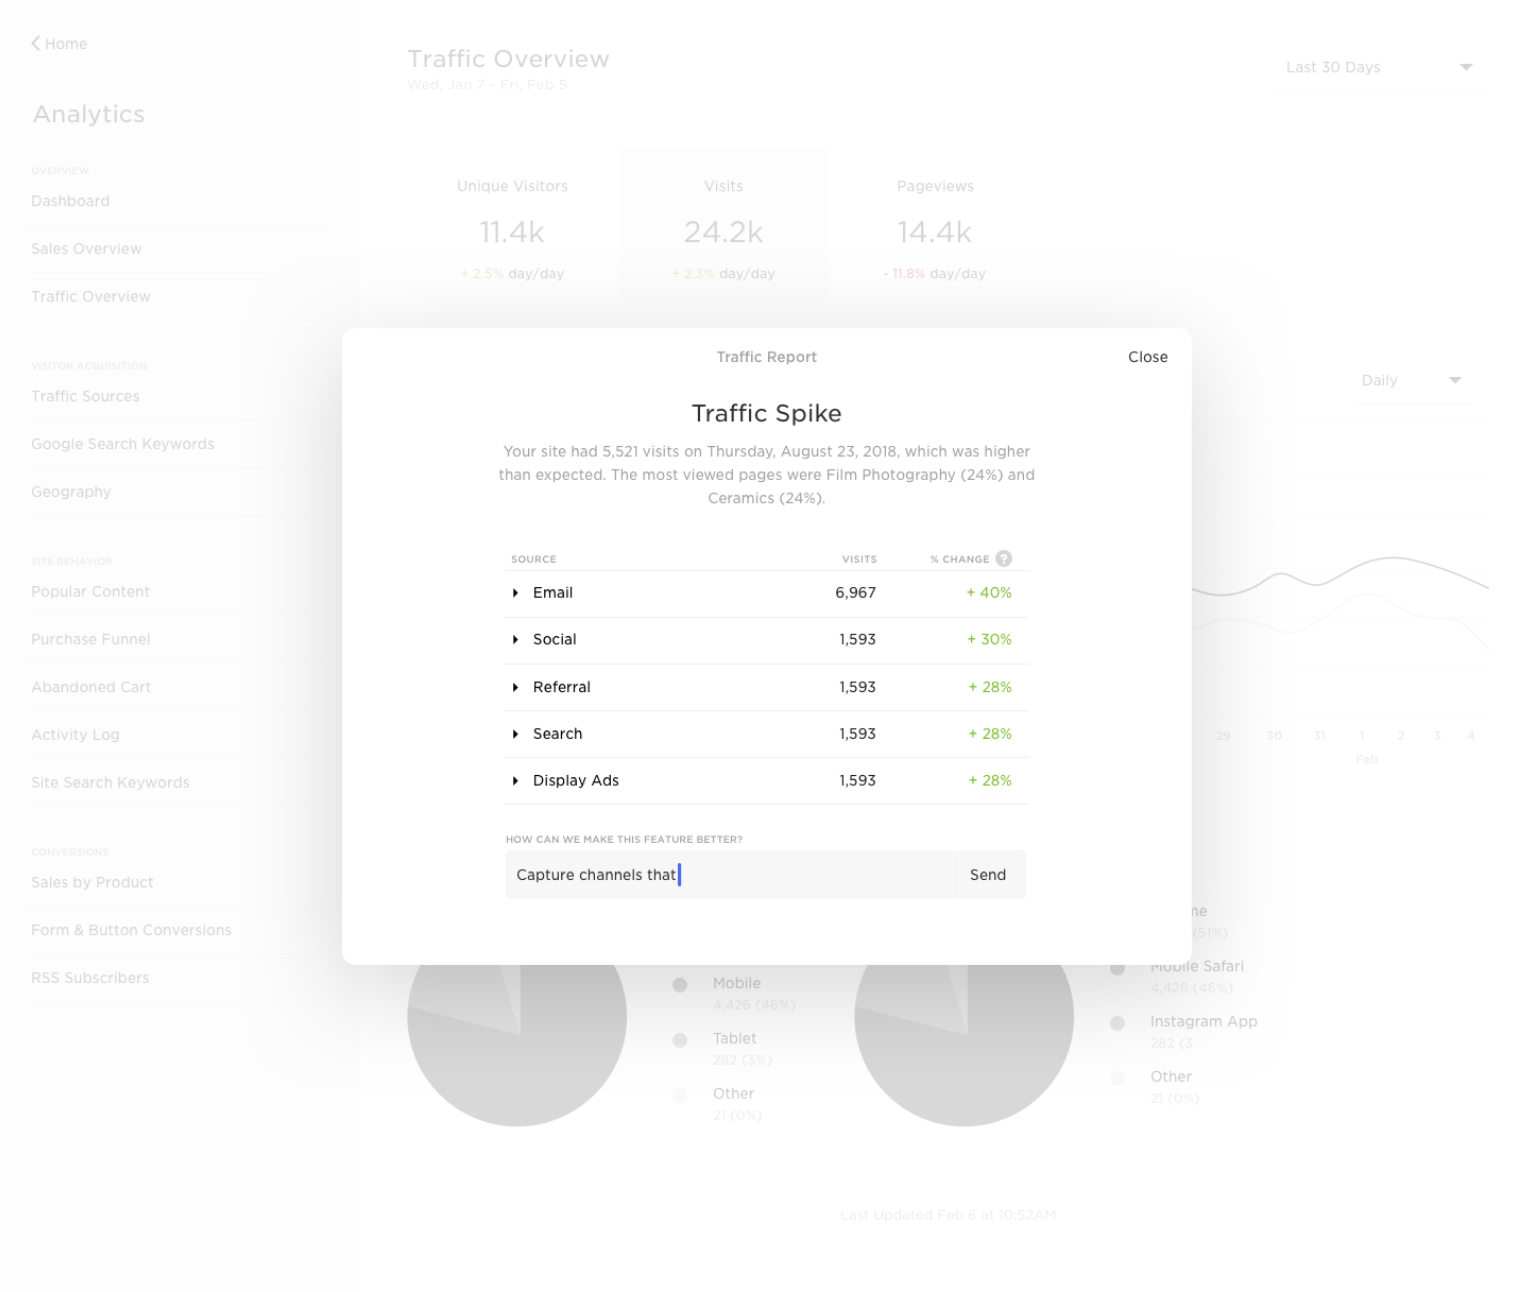
Entry Points
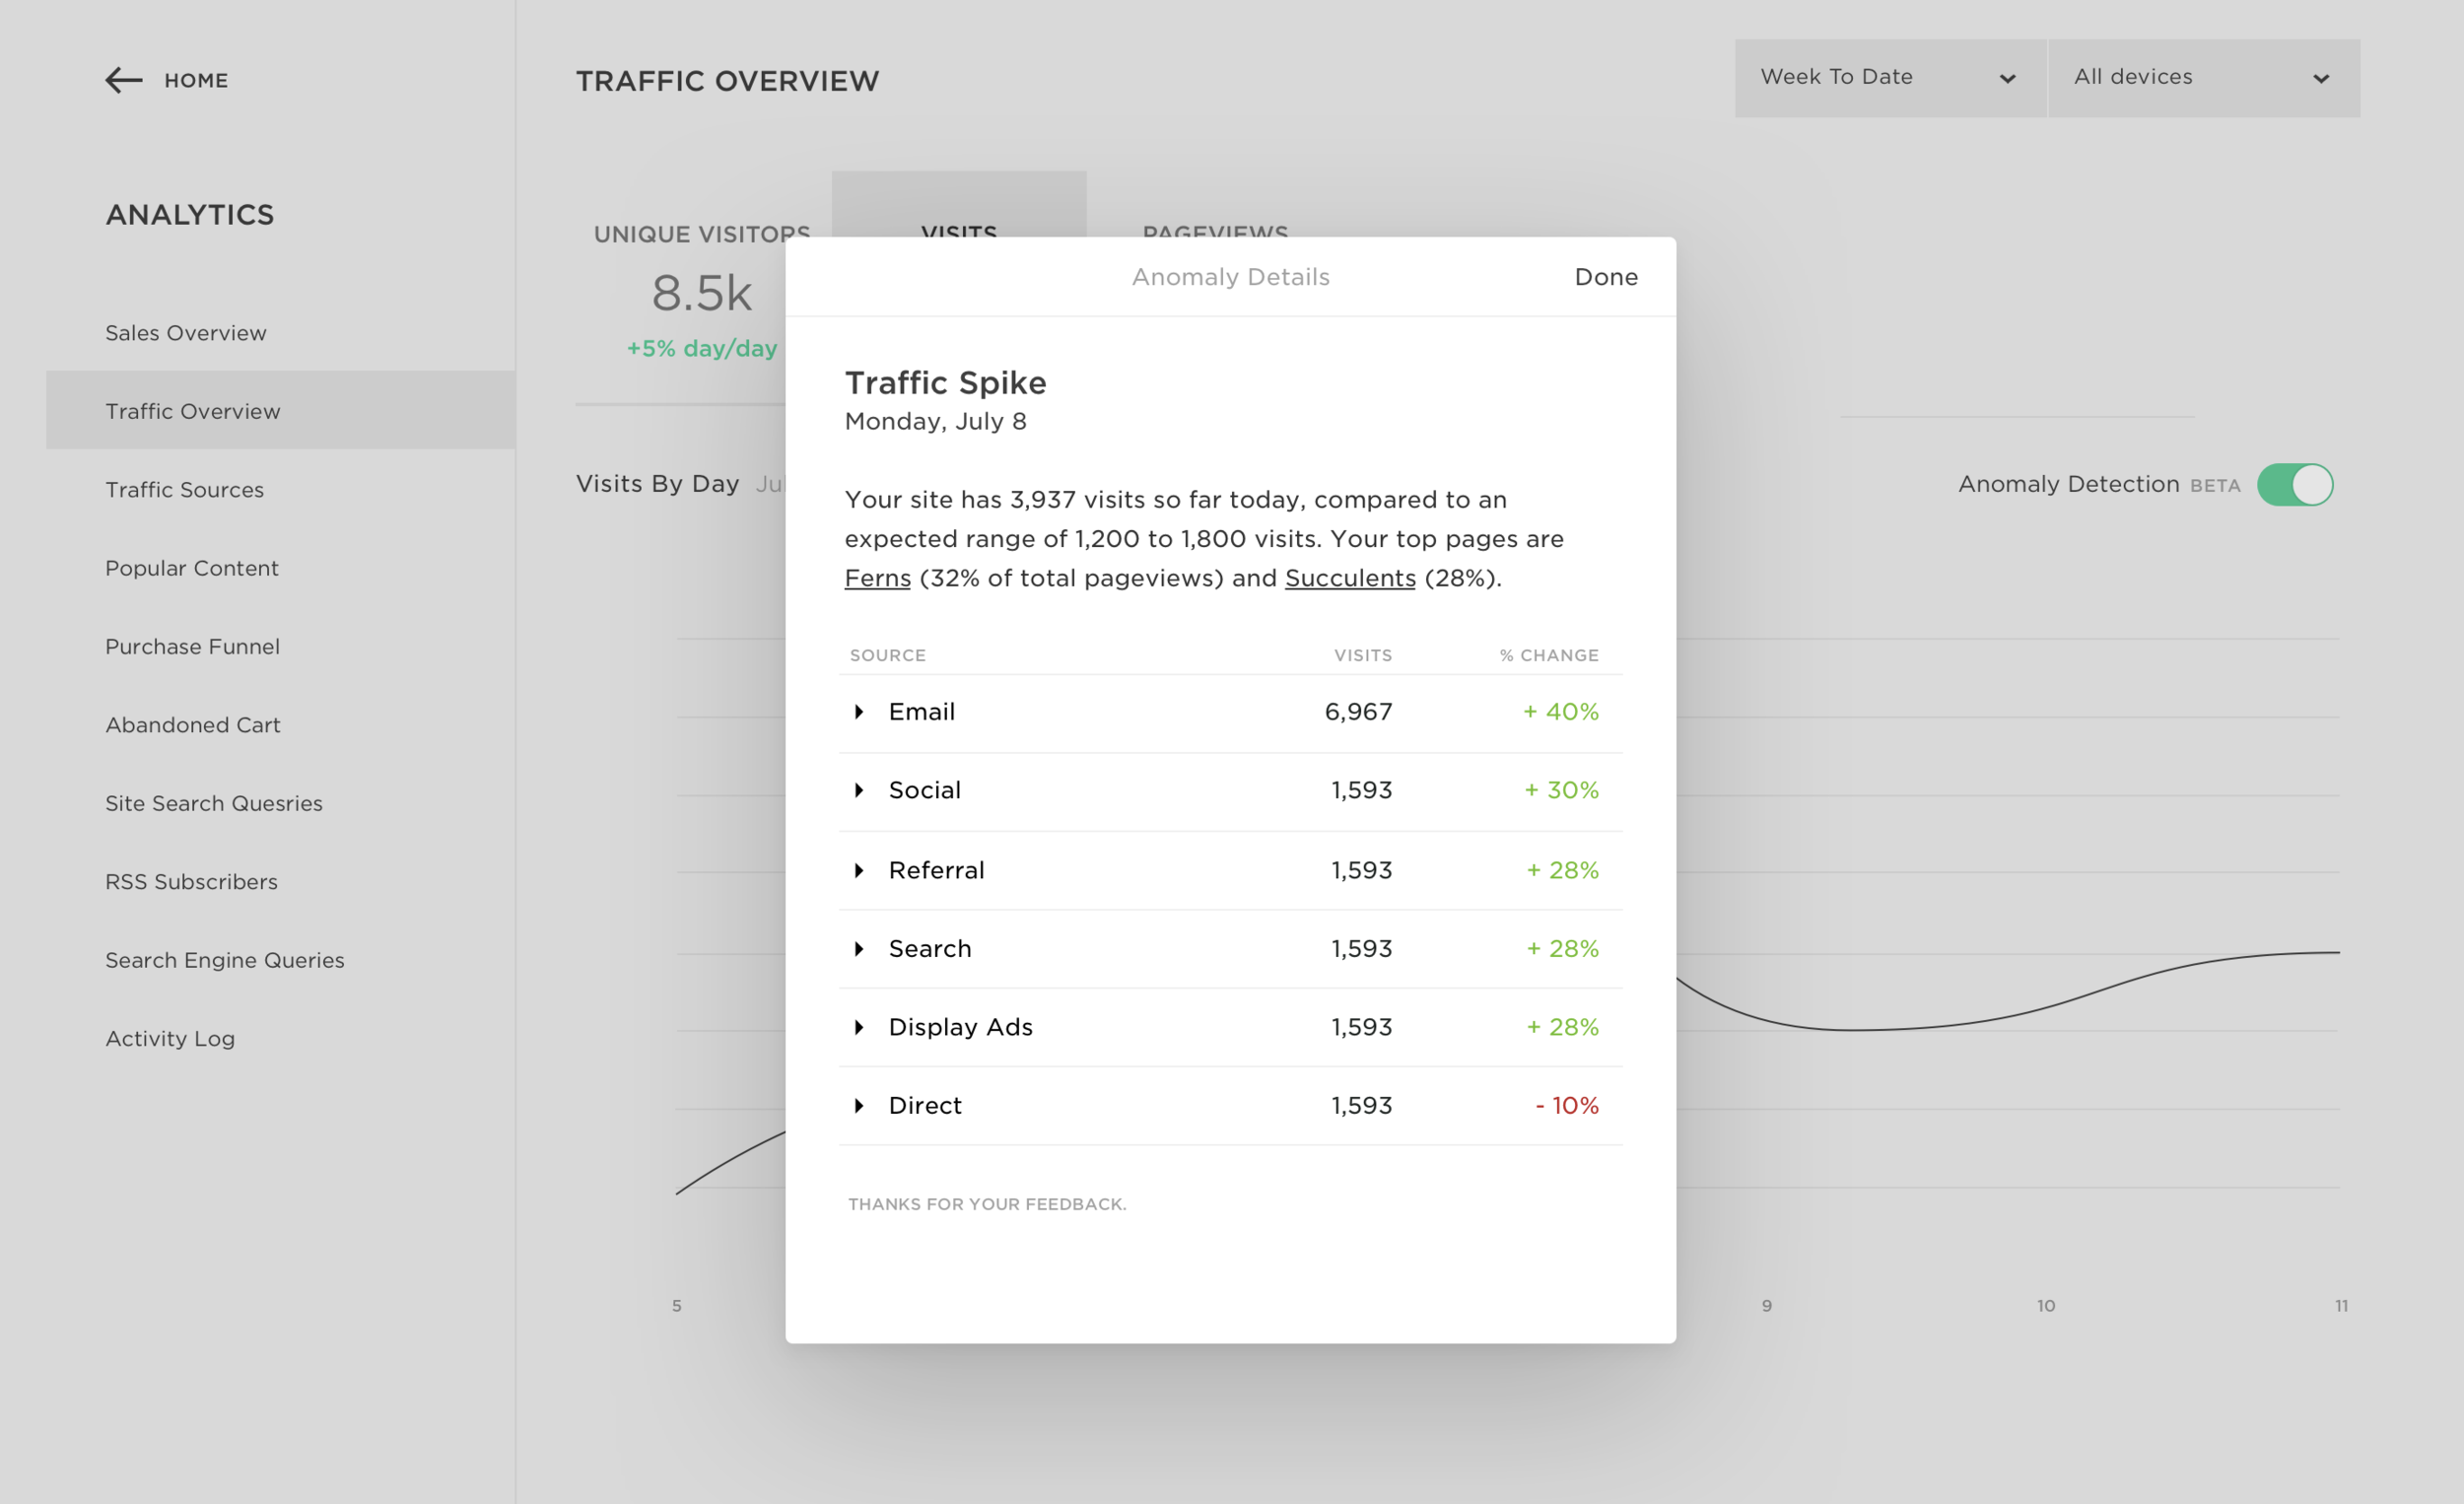
Users can access Traffic Reports via Traffic Overview
On web, users can hover and select a pulsing traffic anomaly to view its full traffic report.

Feedback Module
Capturing feedback to continuously improve our ML model
On a traffic report, users can rate whether the report was helpful or not and give feedback to inform accuracy, relevancy, and timeliness of data.
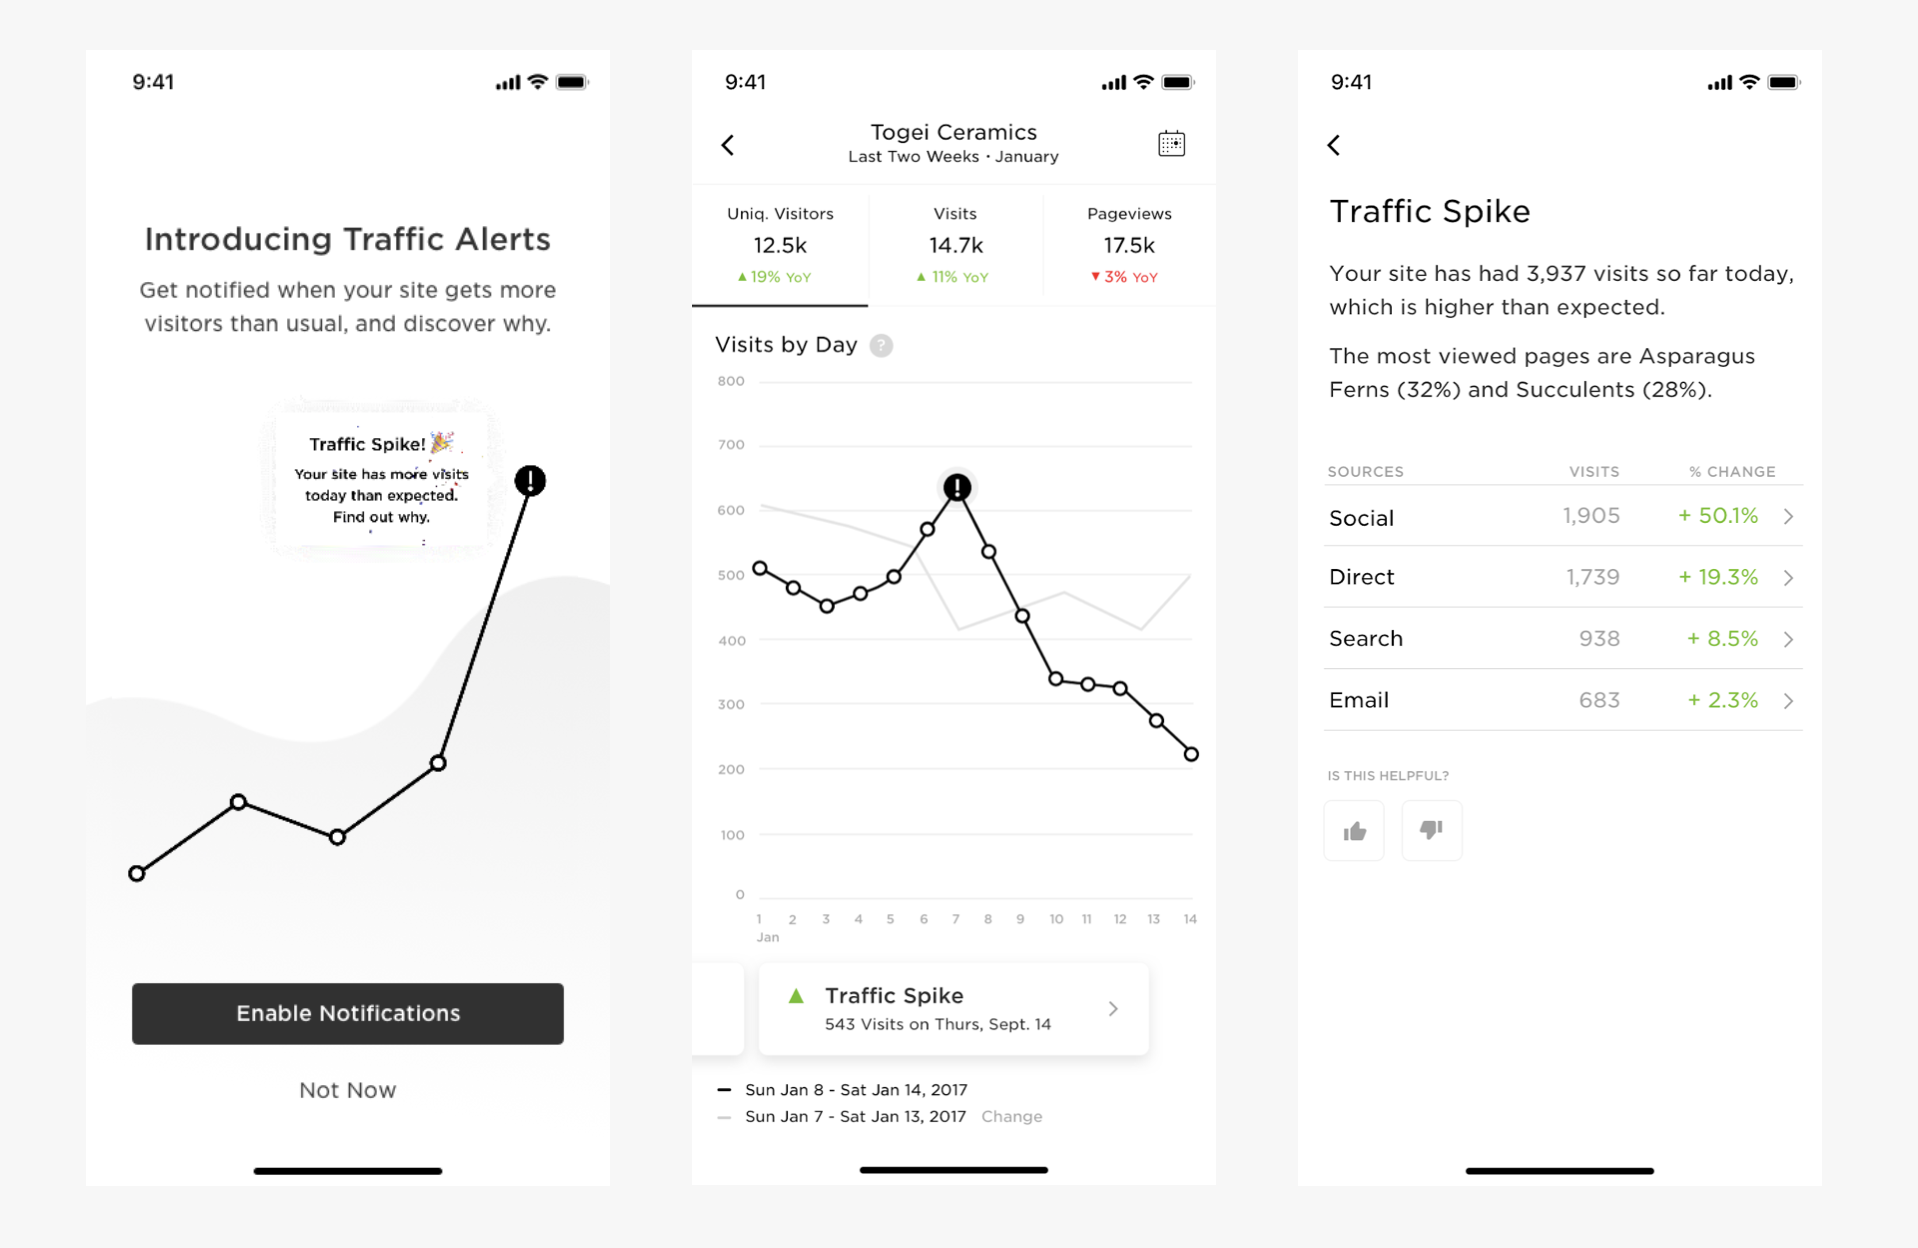
Native iOS & Android
Traffic Report Insights
When users have selected a date range containing a traffic alerts, they can tap cards corresponding to anomalies to view the full report.
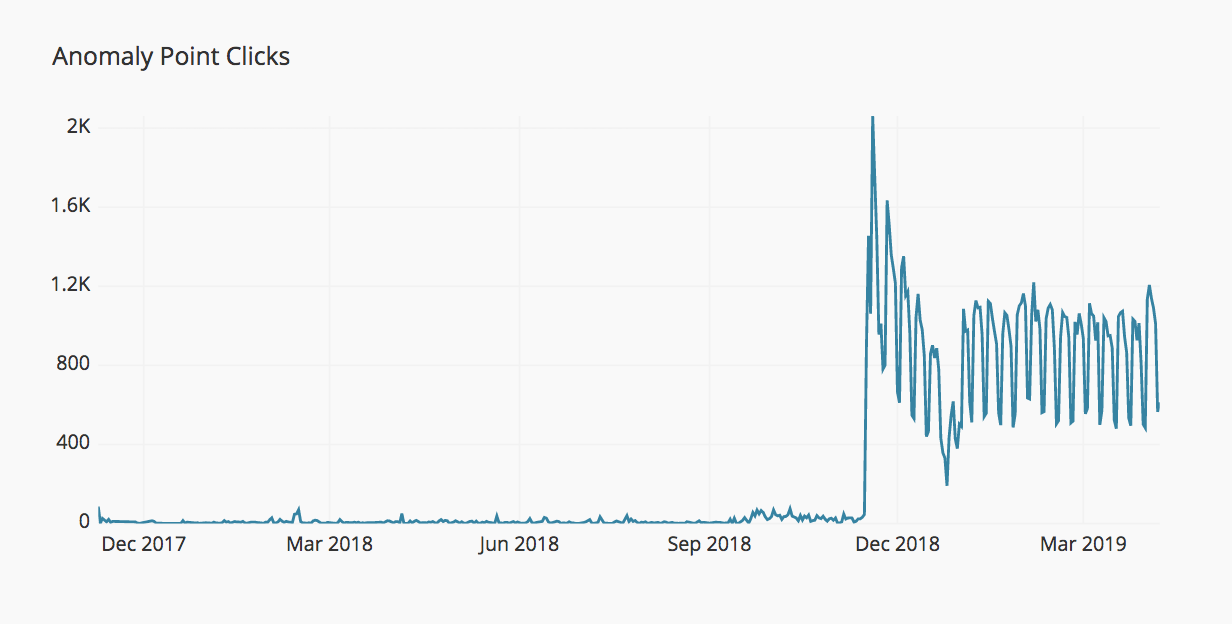
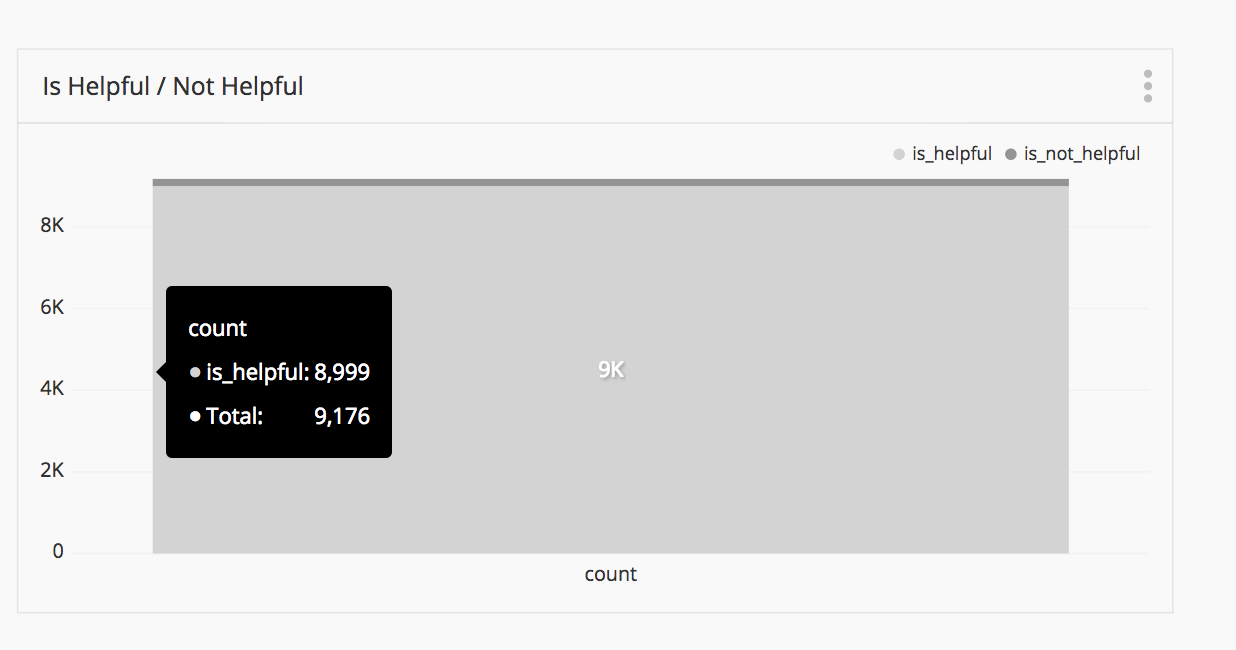
Overall Impact
Though anomalies are rare in nature, with only around 20% of active paid sites experiencing one anomaly in a given month, users have interacted with anomalies over 10,000 times with a 98% helpful rate.