Spotify Charts is a destination for artists and fans to see what music is moving listeners around the world. Think Billboard, but for Spotify. Over 8 months, my team design sprinted, researched, beta tested, and launched a new charts ecosystem to target a new generation of fans to celebrate success for artists at any scale, from indie to superstar.
Role
Senior Product Designer, Design Lead
Timeline
8 months
Goals & Objective
Evolve Spotify Charts to become the new barometer of success as an artist on Spotify.
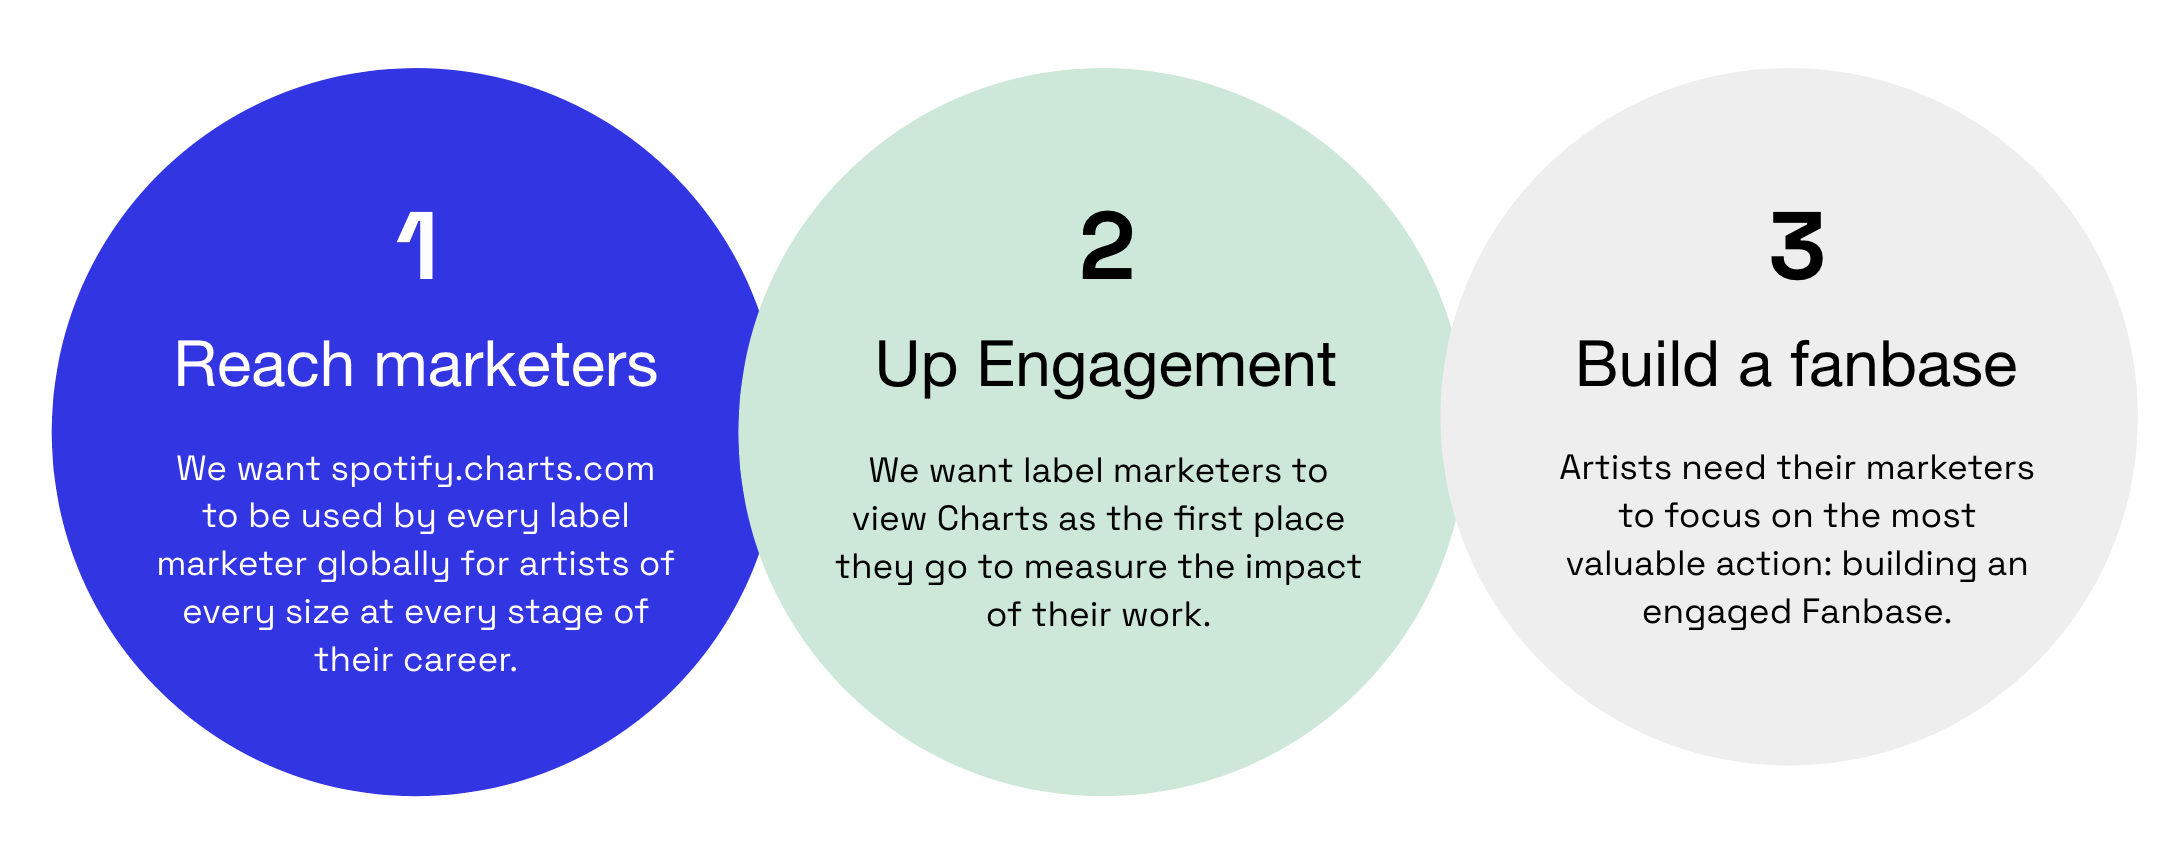
Key Result
KR1: Reach 200k logged in monthly active users. ✅
KR2: Increase the coverage of non-major entities across our charts from 20% to 40%. ✅

A new identity
A front door broadcasting our offerings, top 50 artists, songs, and albums, and our social channels. Highlight Spotify Charts’ unique role in the industry, and incentivize logging in.
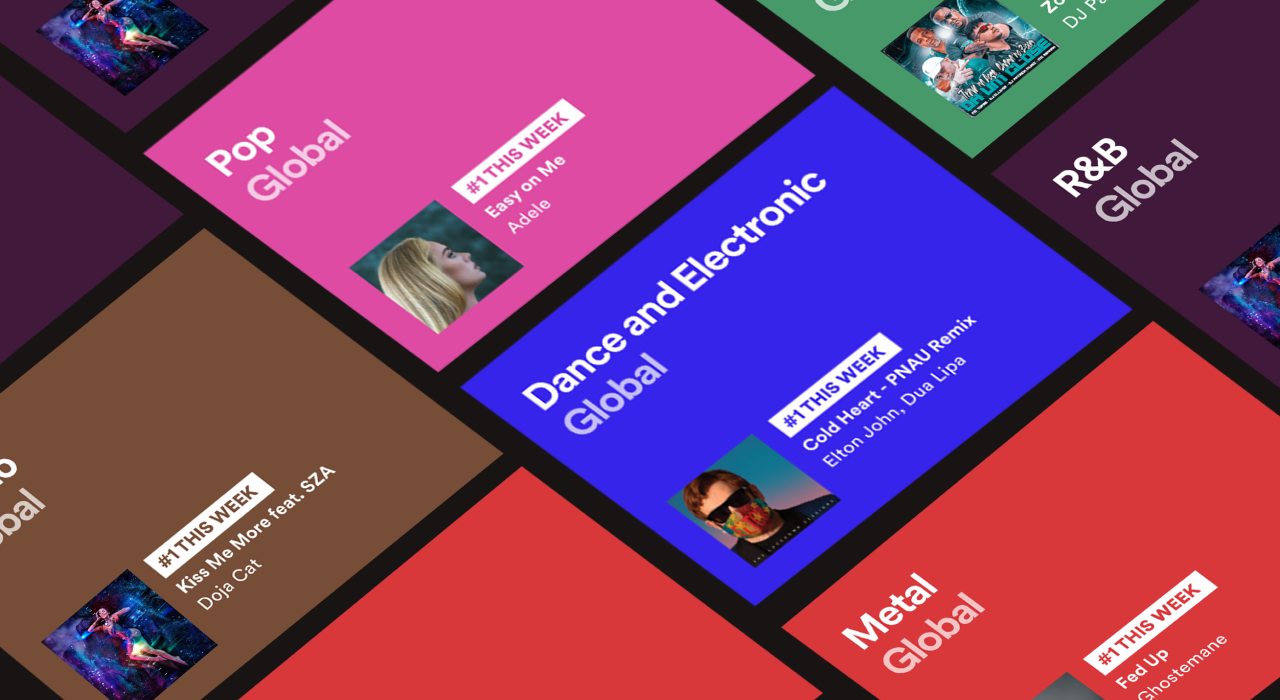
Insights driven
Charting insights (e.g. greatest gainer, longest streak, highest new entry, etc.) to serve as notable highlights in the music industry. Background colors extracted from images guarantee accessible color contrasts.
Scalable IA
A resilient site architecture that is both easy to navigate and can also support new future chart types, data, and insights.
New chart types
Brand new charts (Artist Charts, Genre Charts, City Charts, and Local Pulse Charts) to give more artists, particularly mid tiered artists, the opportunity to reach positions globally.
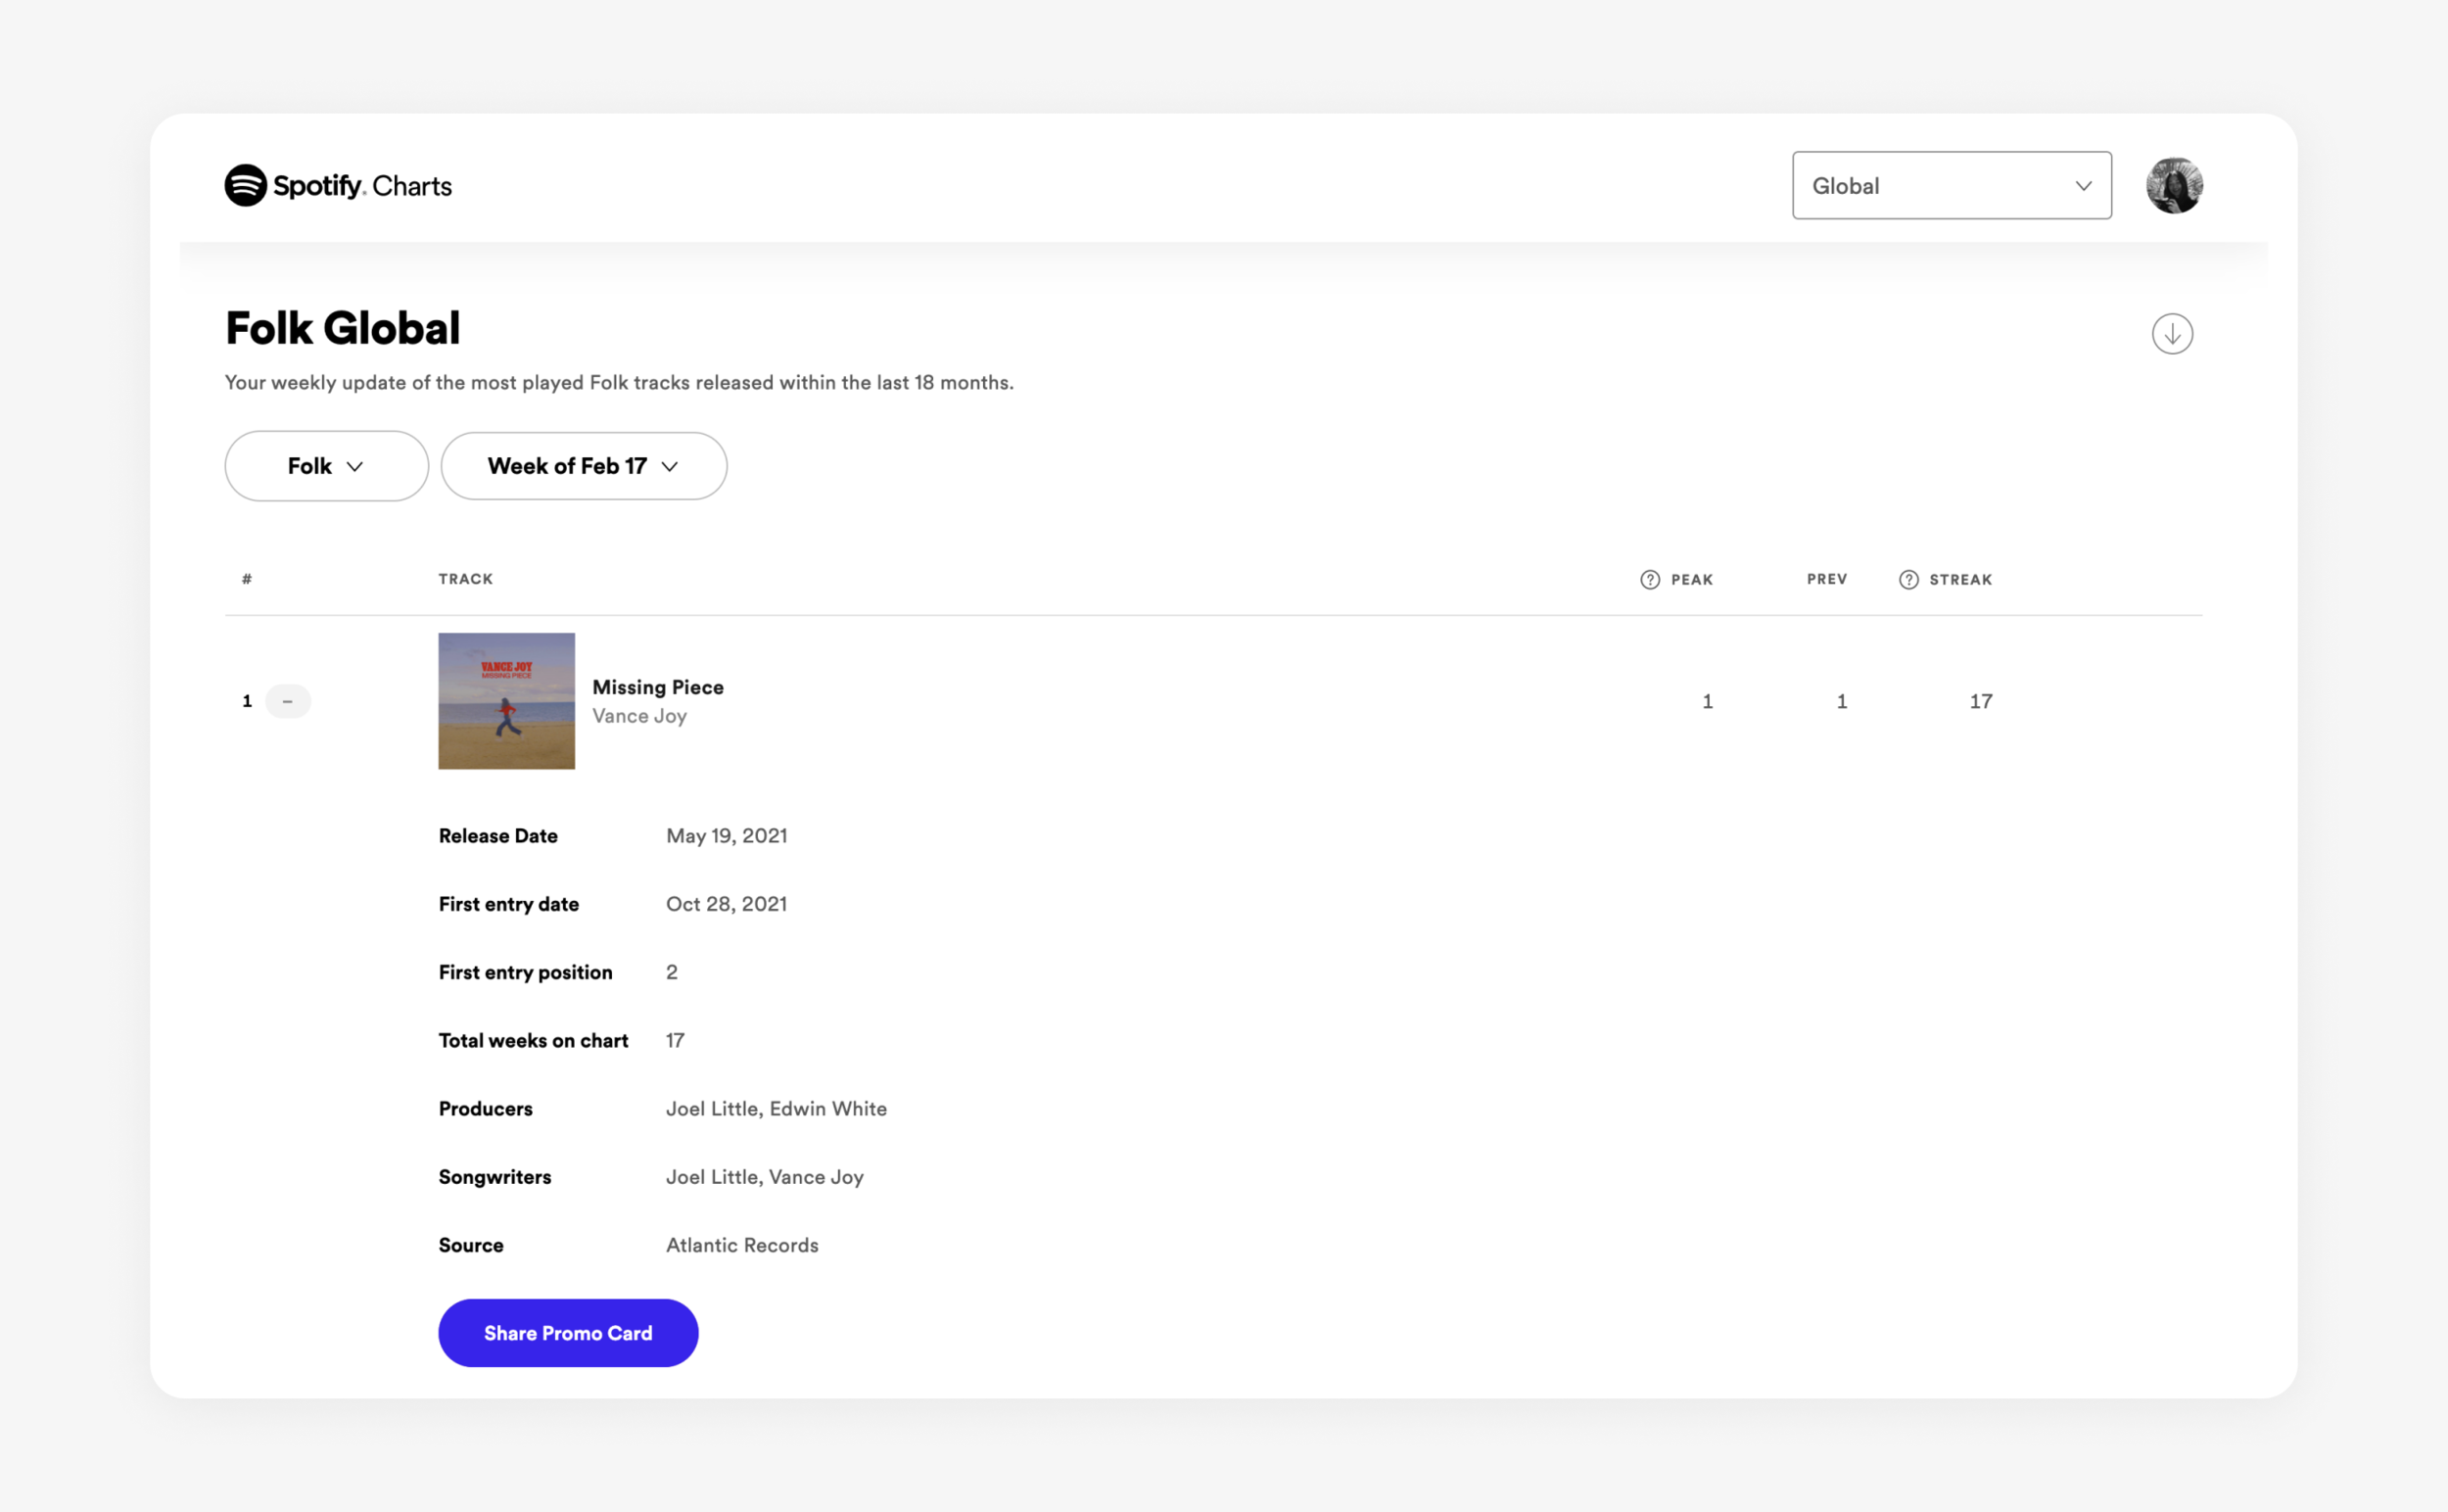
Data & filtering
Detailed stats like streaks, peak position, and song credits so that users can dive deep into charts data. Robust filtering mechanisms across countries, cities, genres, dates, and more.
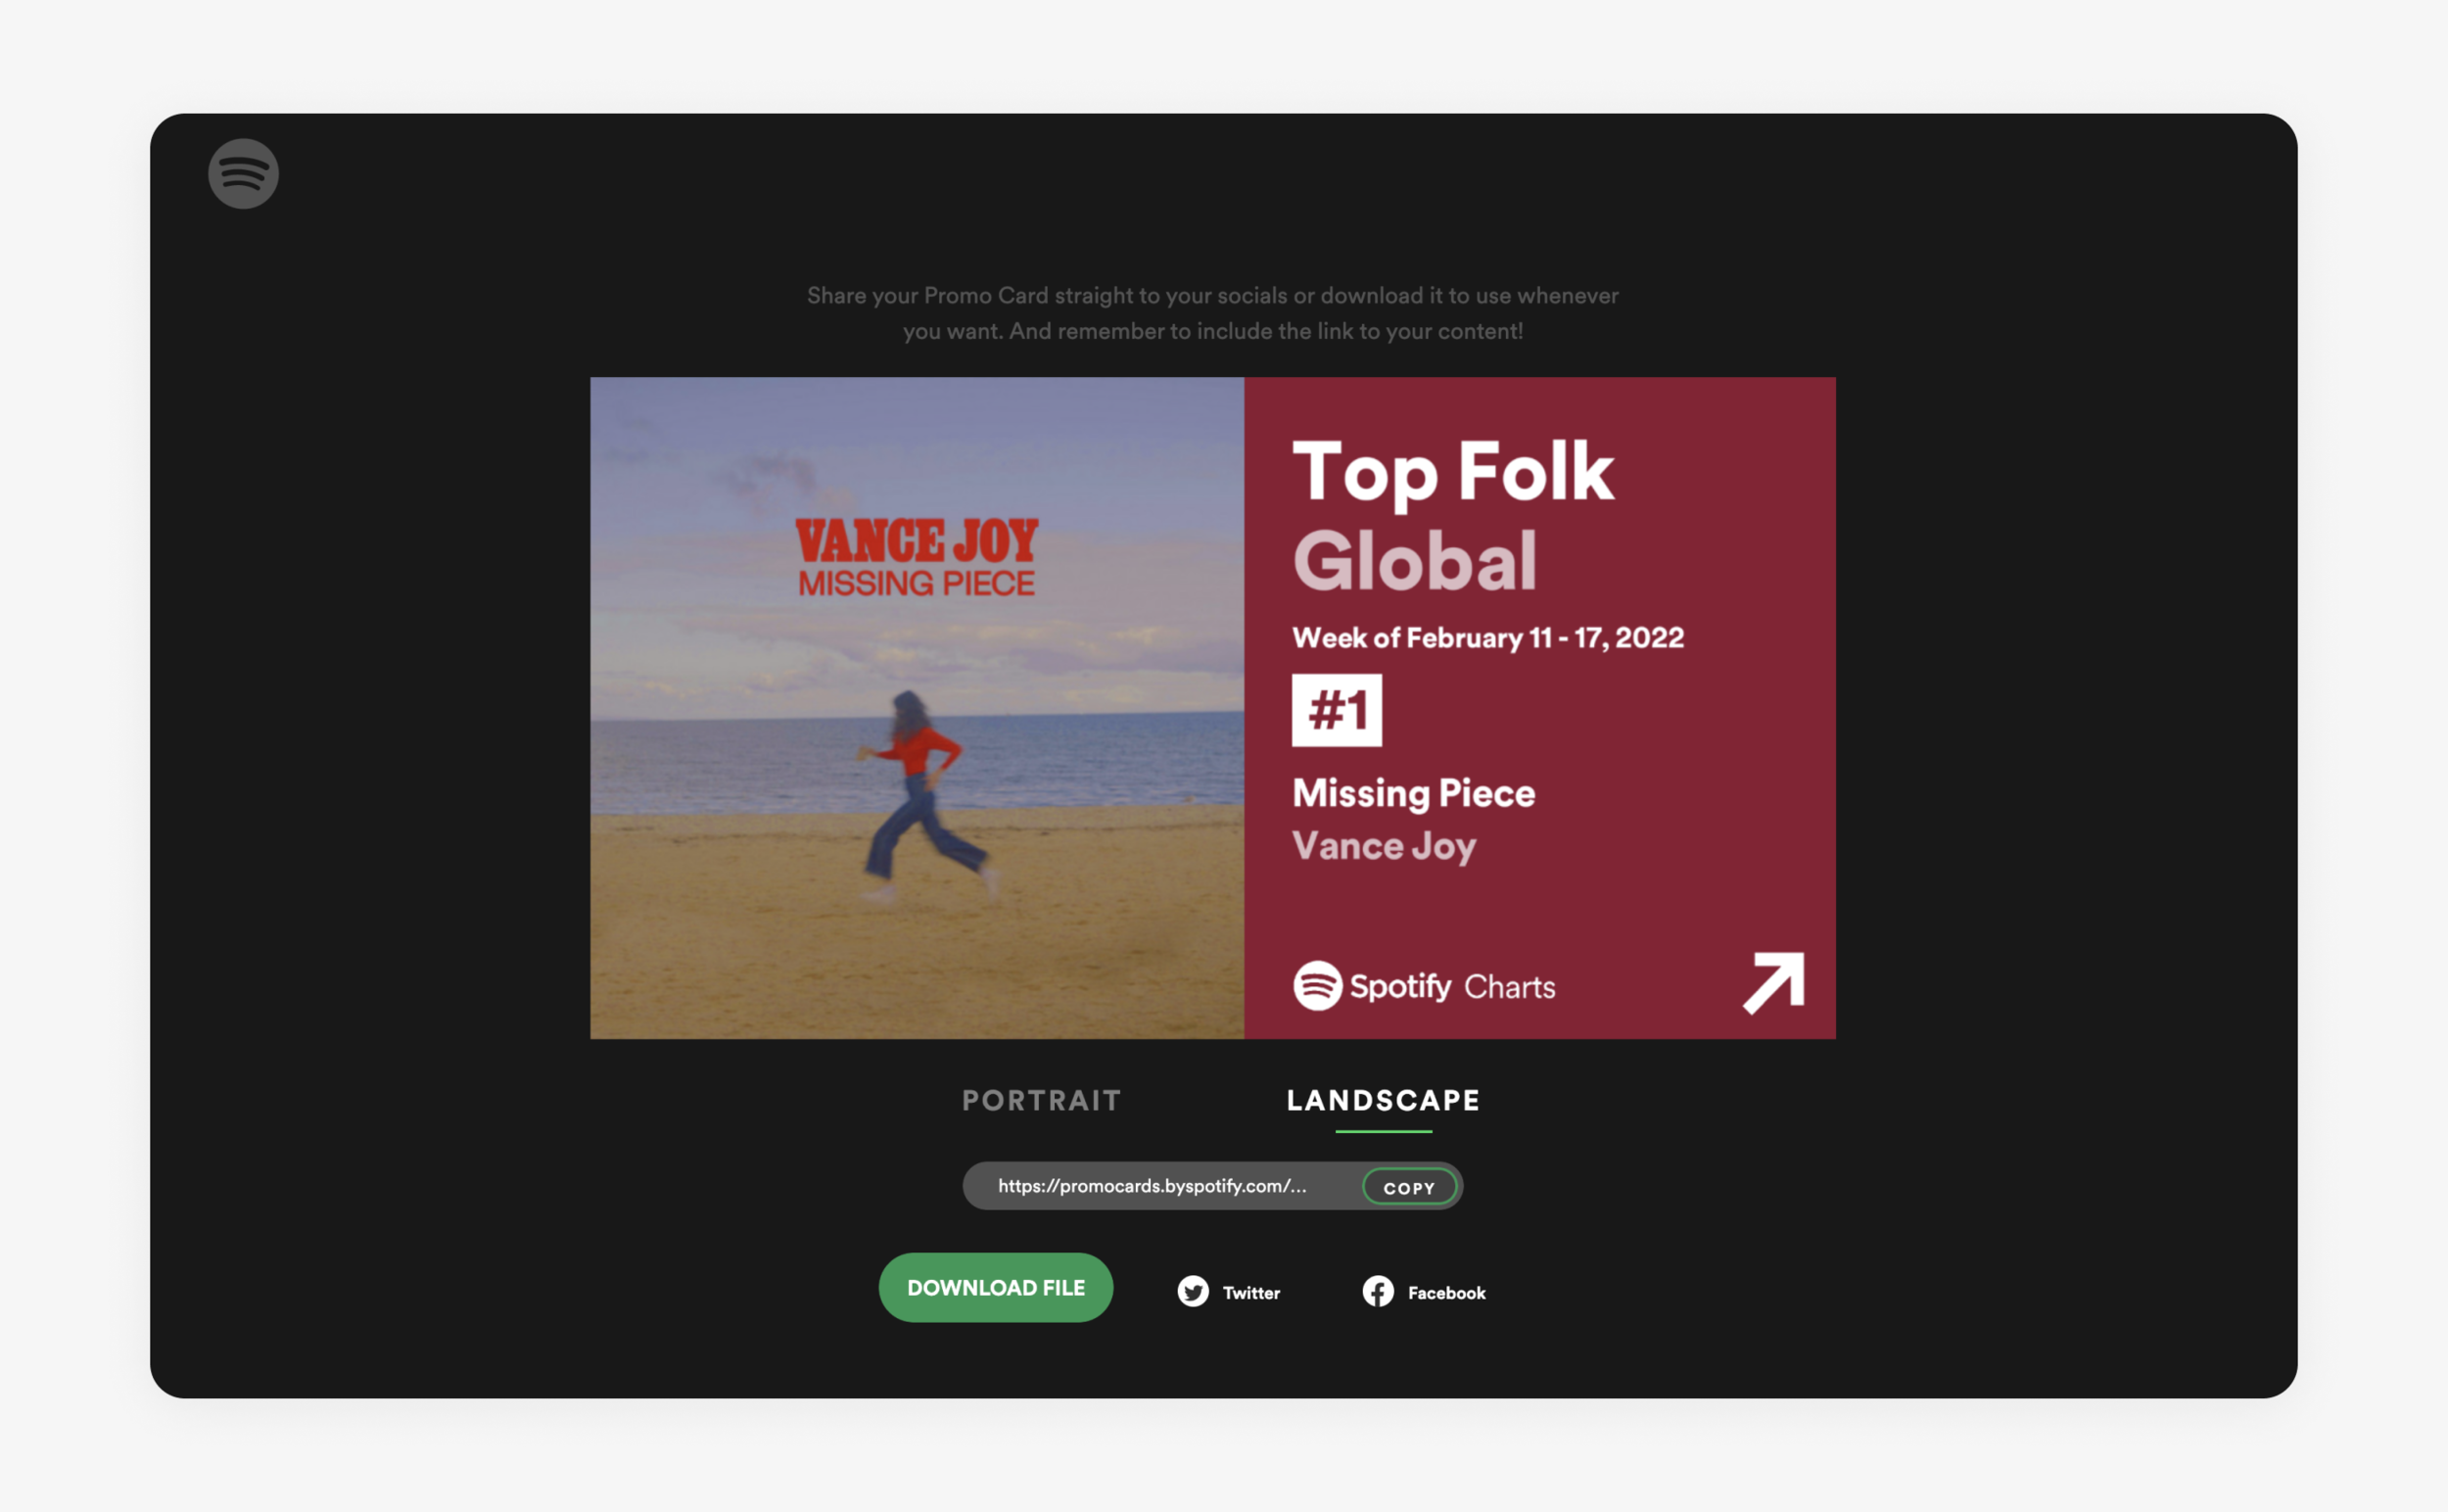
Made for sharing
Milestones are made for celebrating. We evolved promocards.byspotify.com to generate assets for artists and their fans to celebrate their charting wins on social channels.
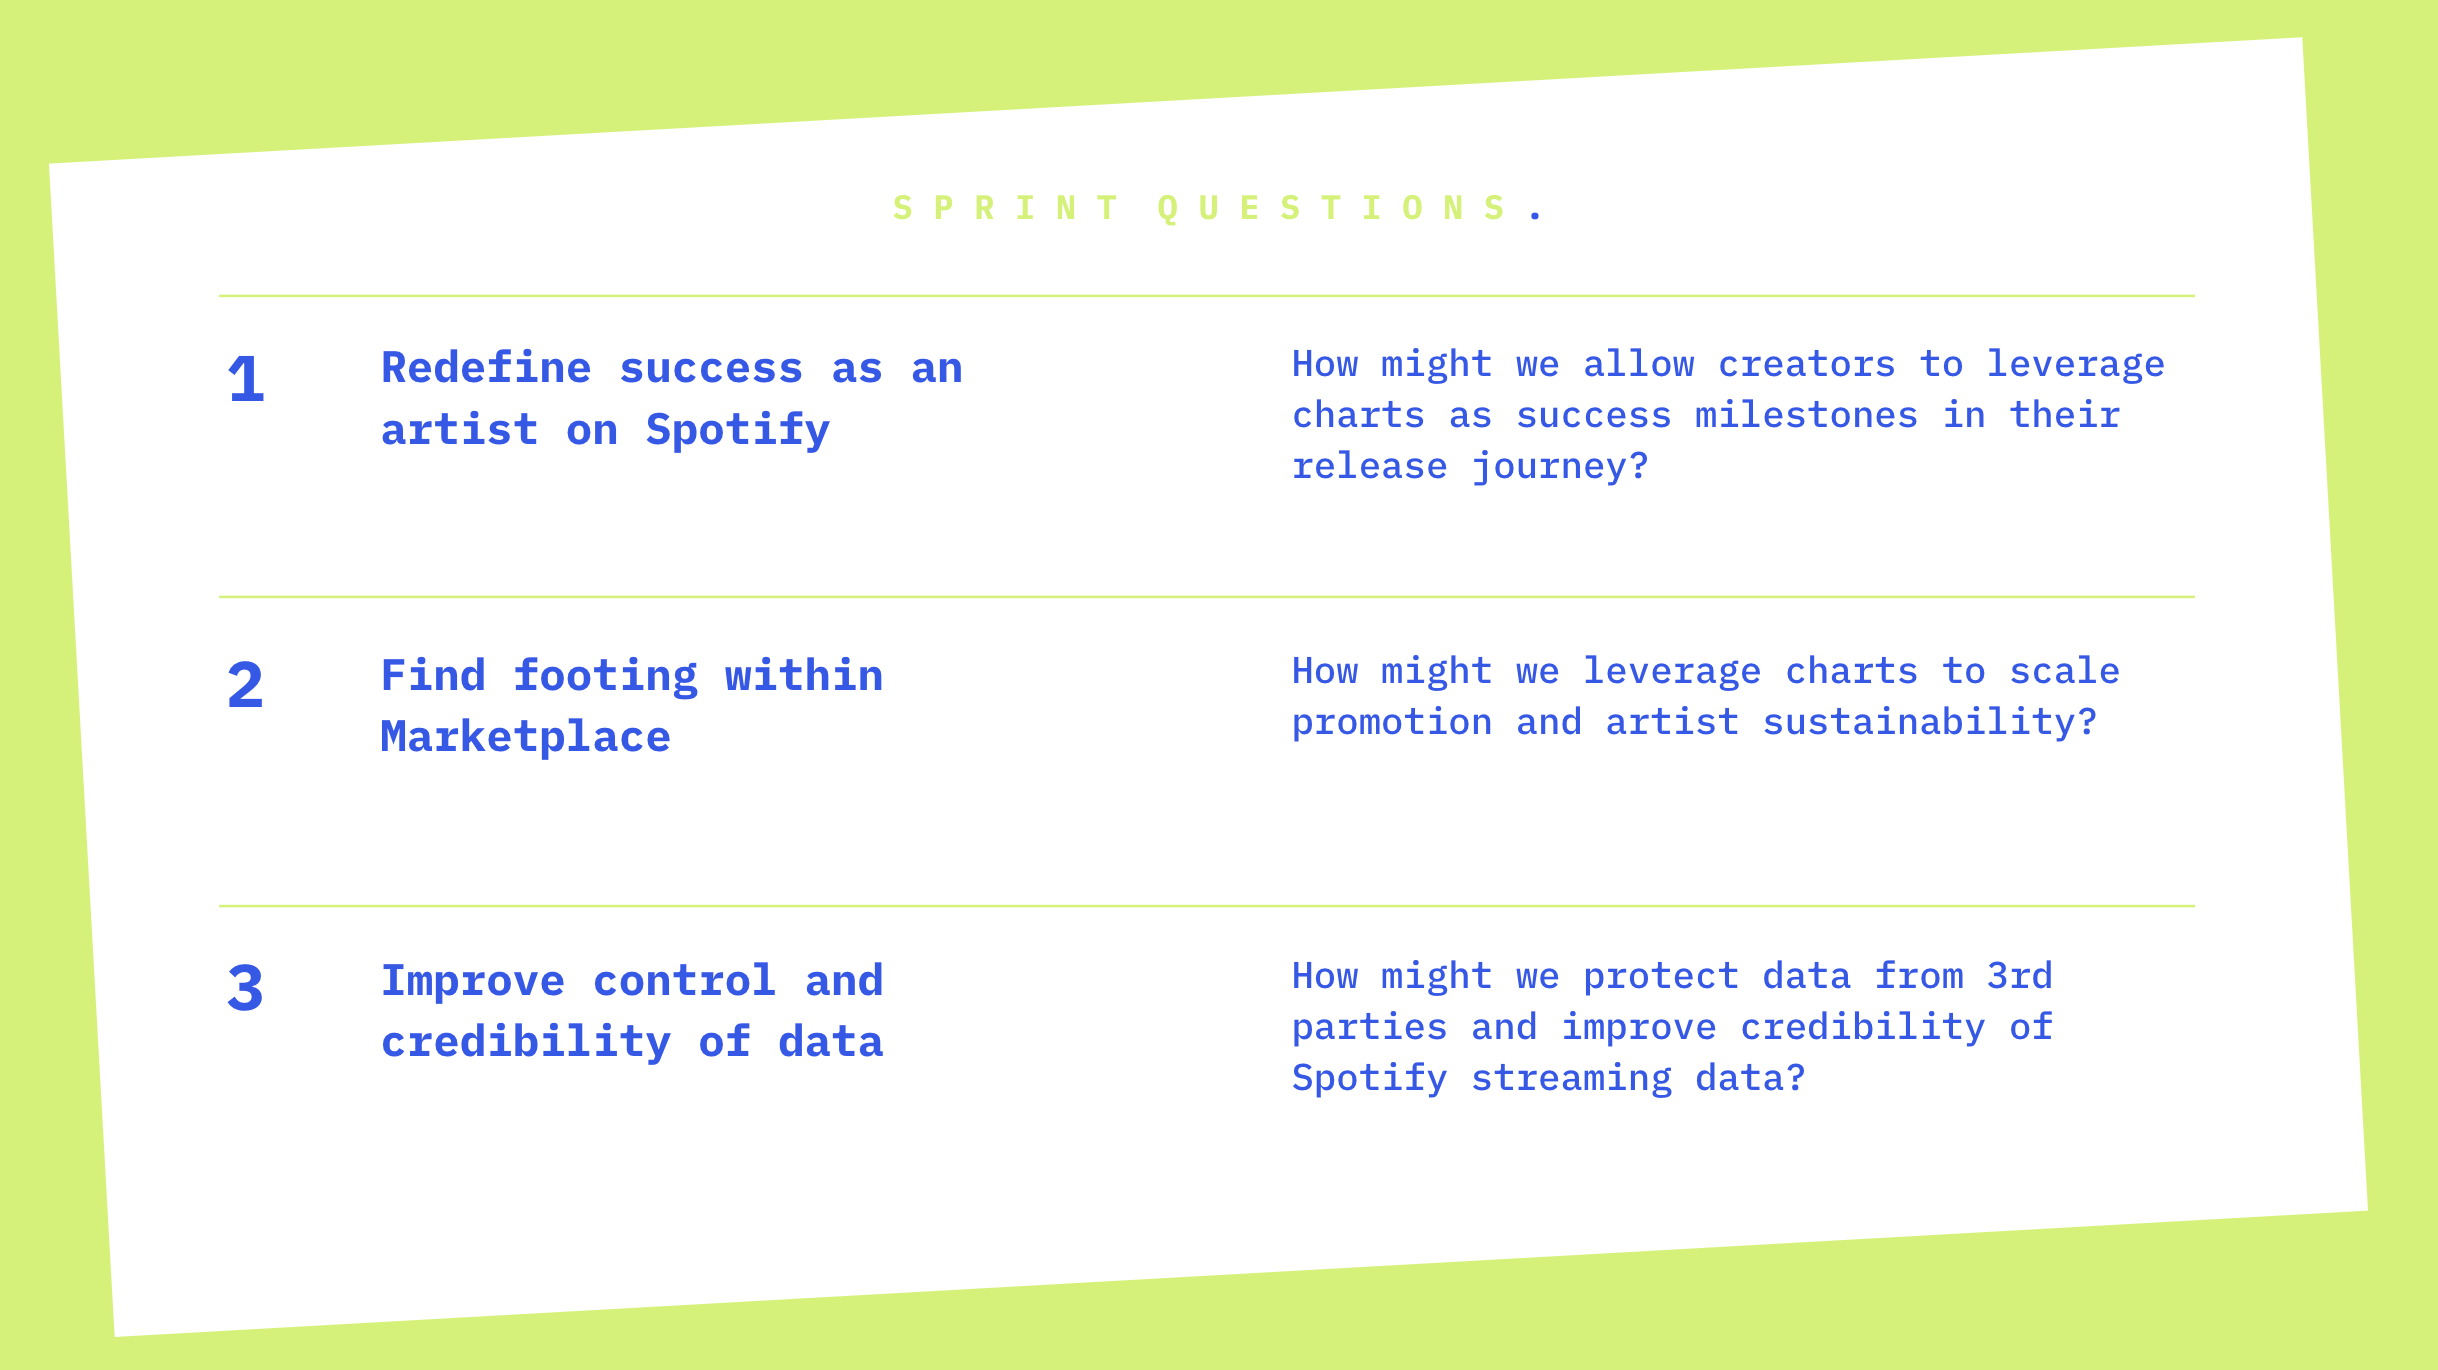
It started with a sprint
We began this enormous piece of work with a cross-functional design sprint (team + PMM, UXR, UXW, Artist & Label Partnerships, & others) to think about evolving Spotify Charts to earn industry credibility, guardrail data against competitors and 3rd party tools, and most importantly, re-define how success is measured for an artist on Spotify.
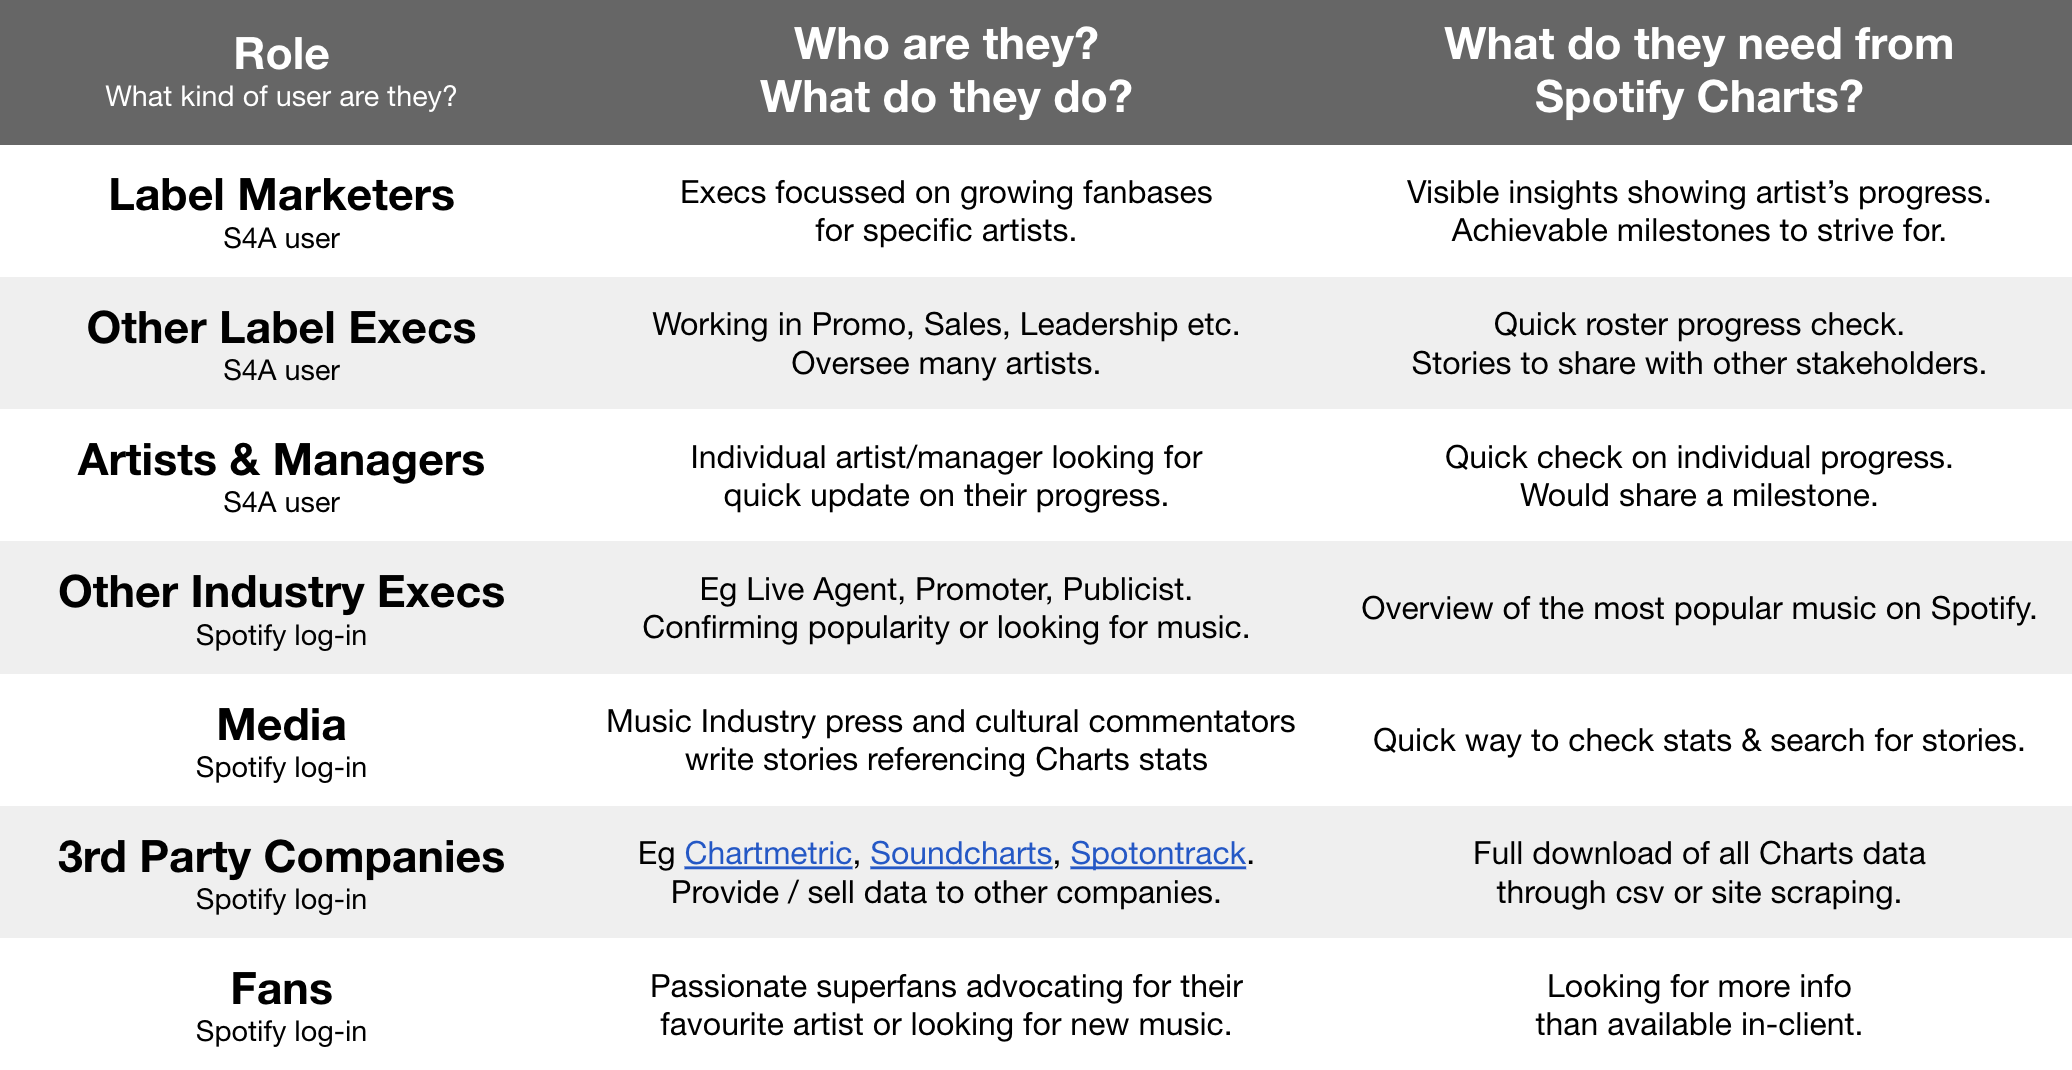
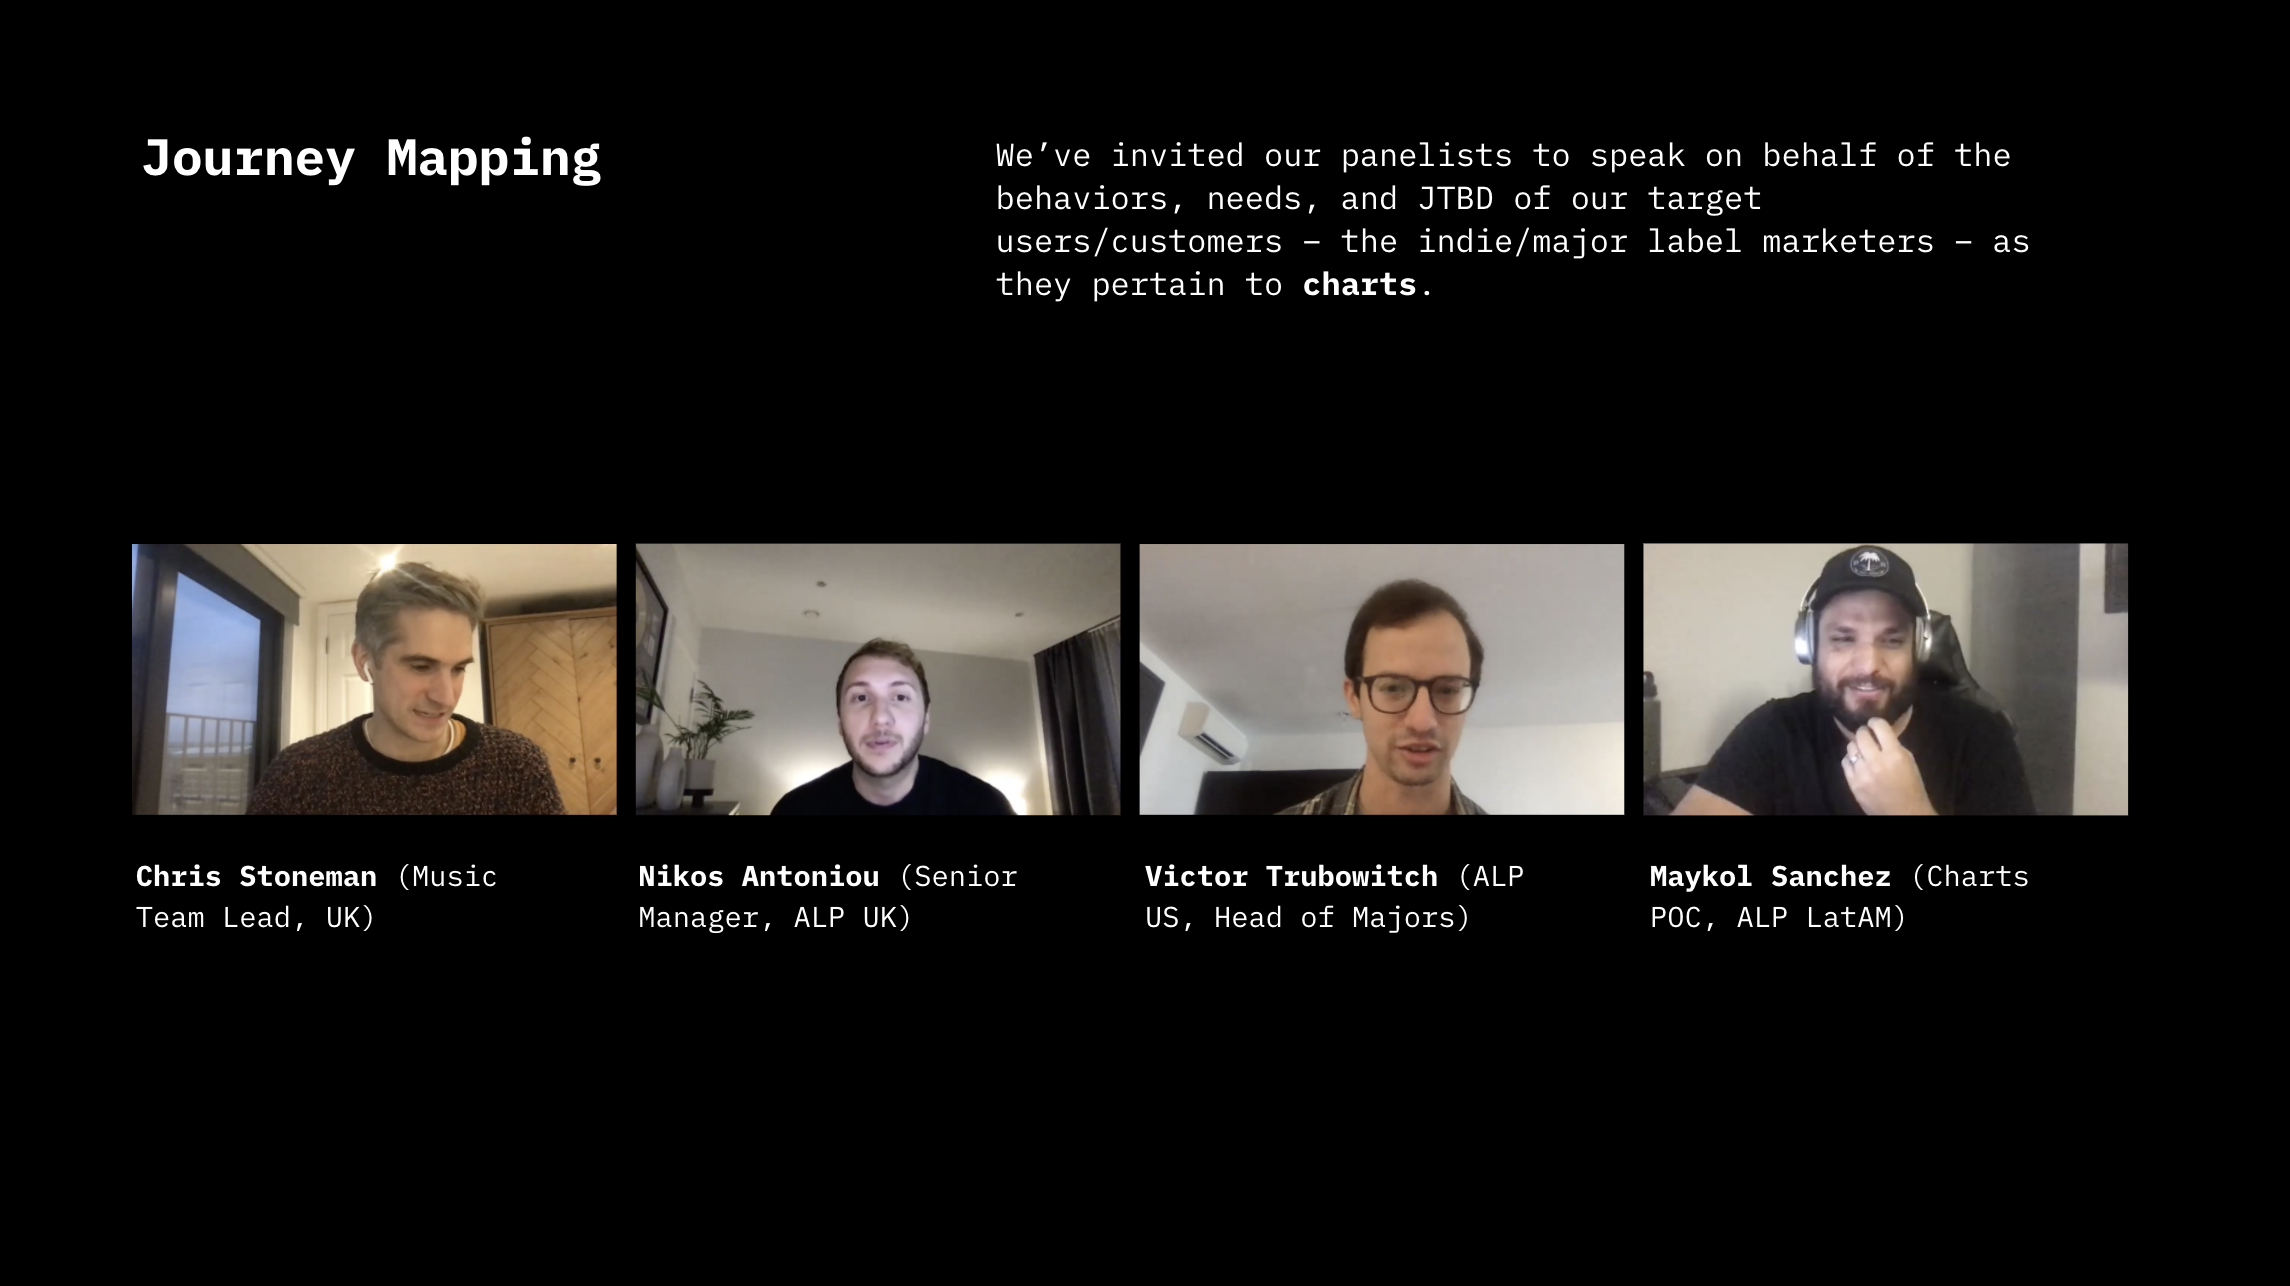
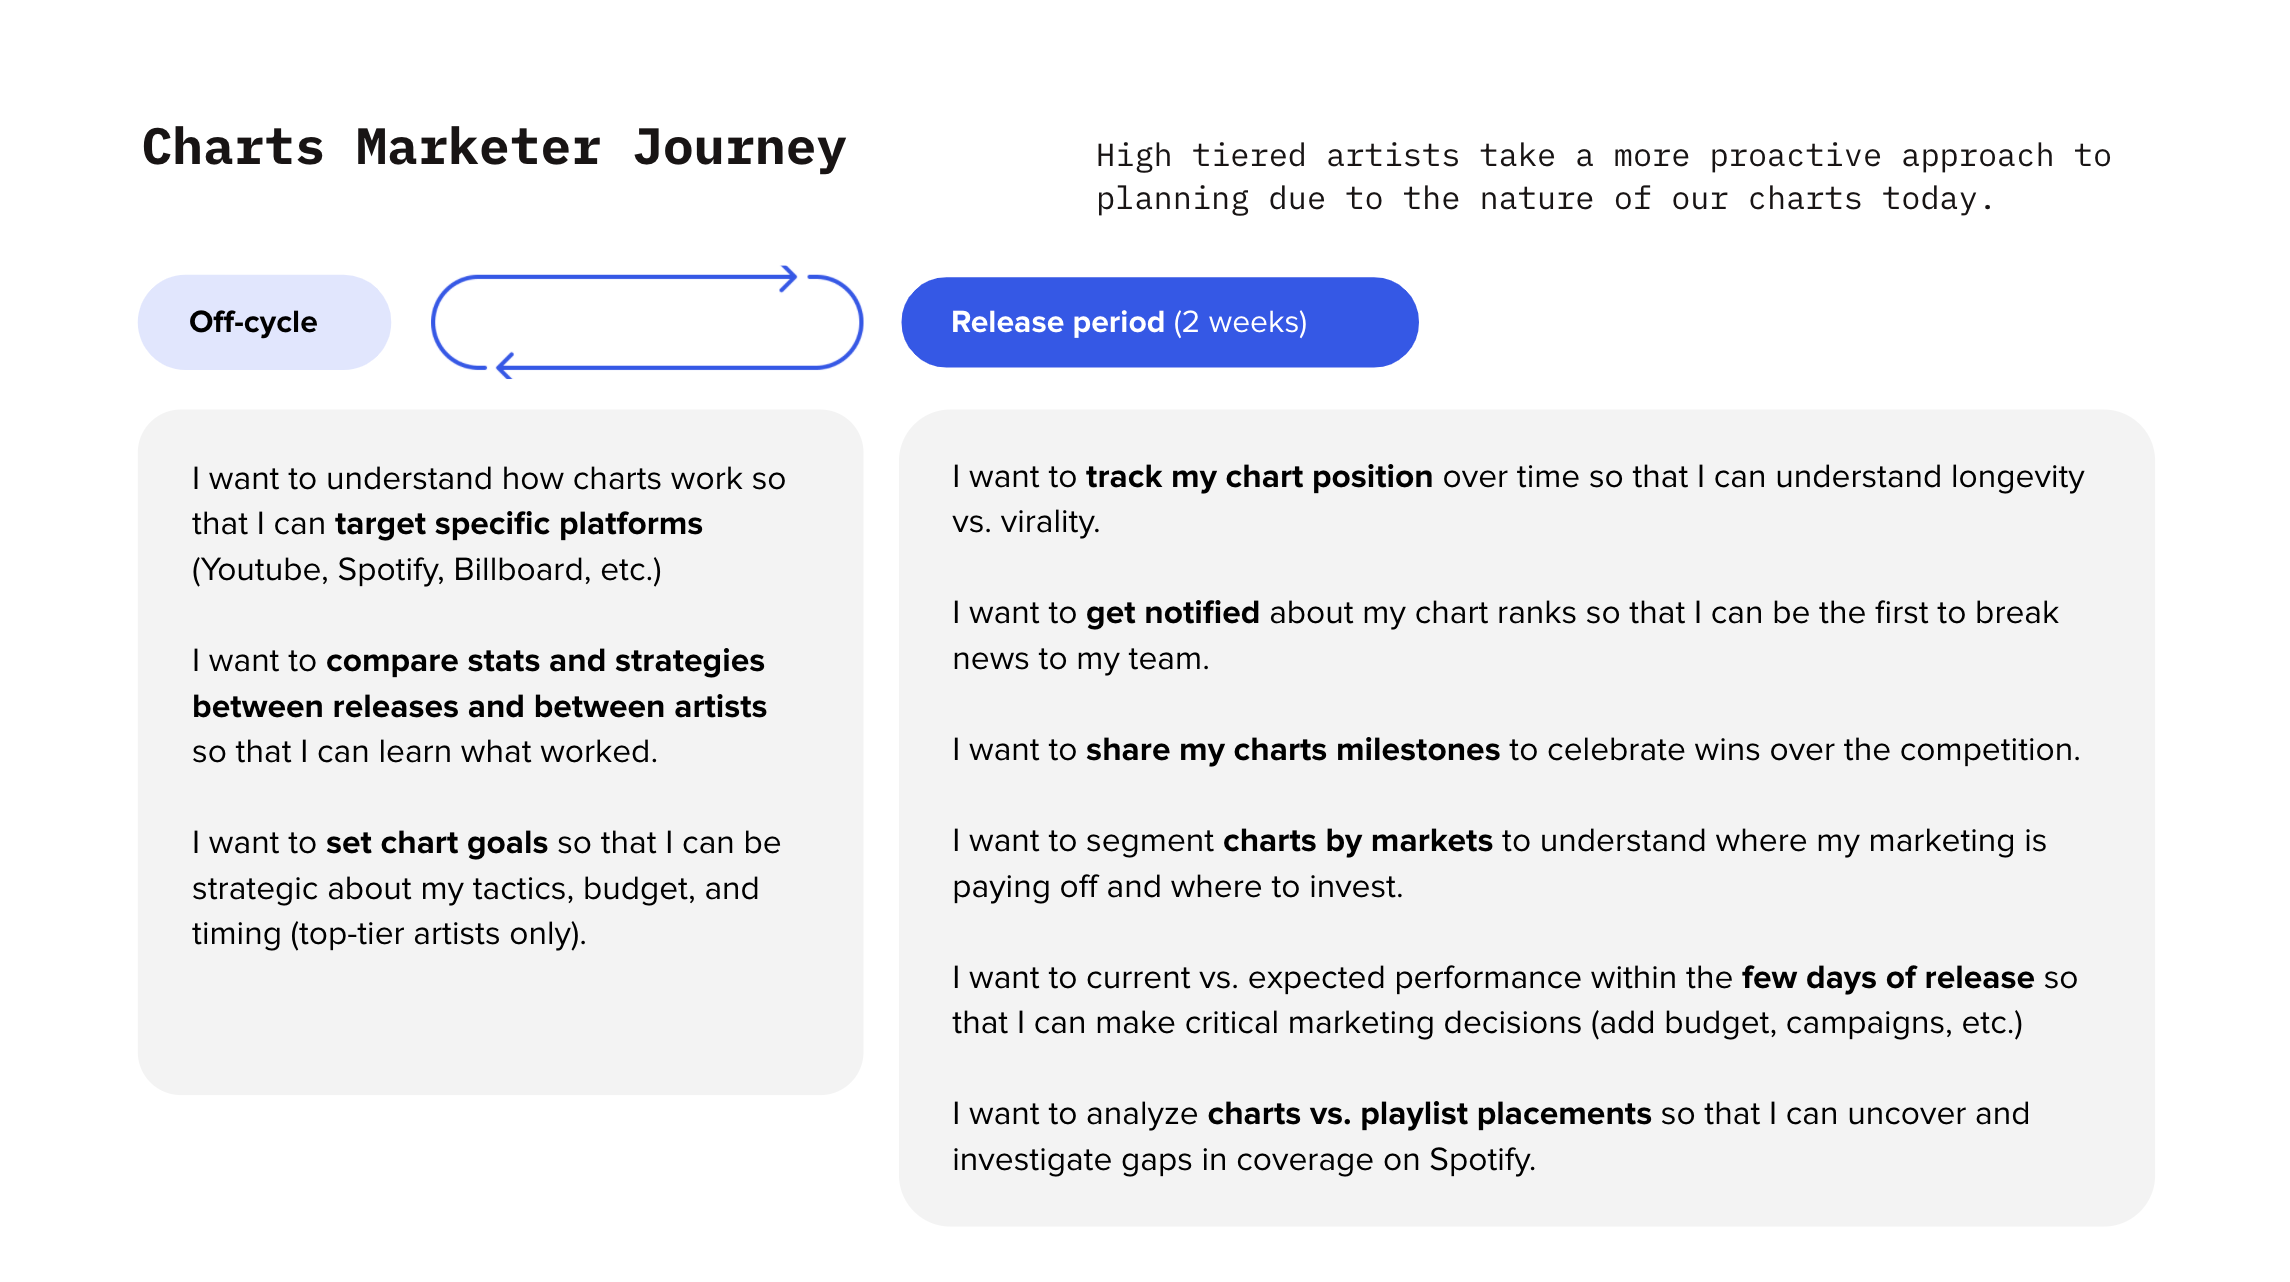
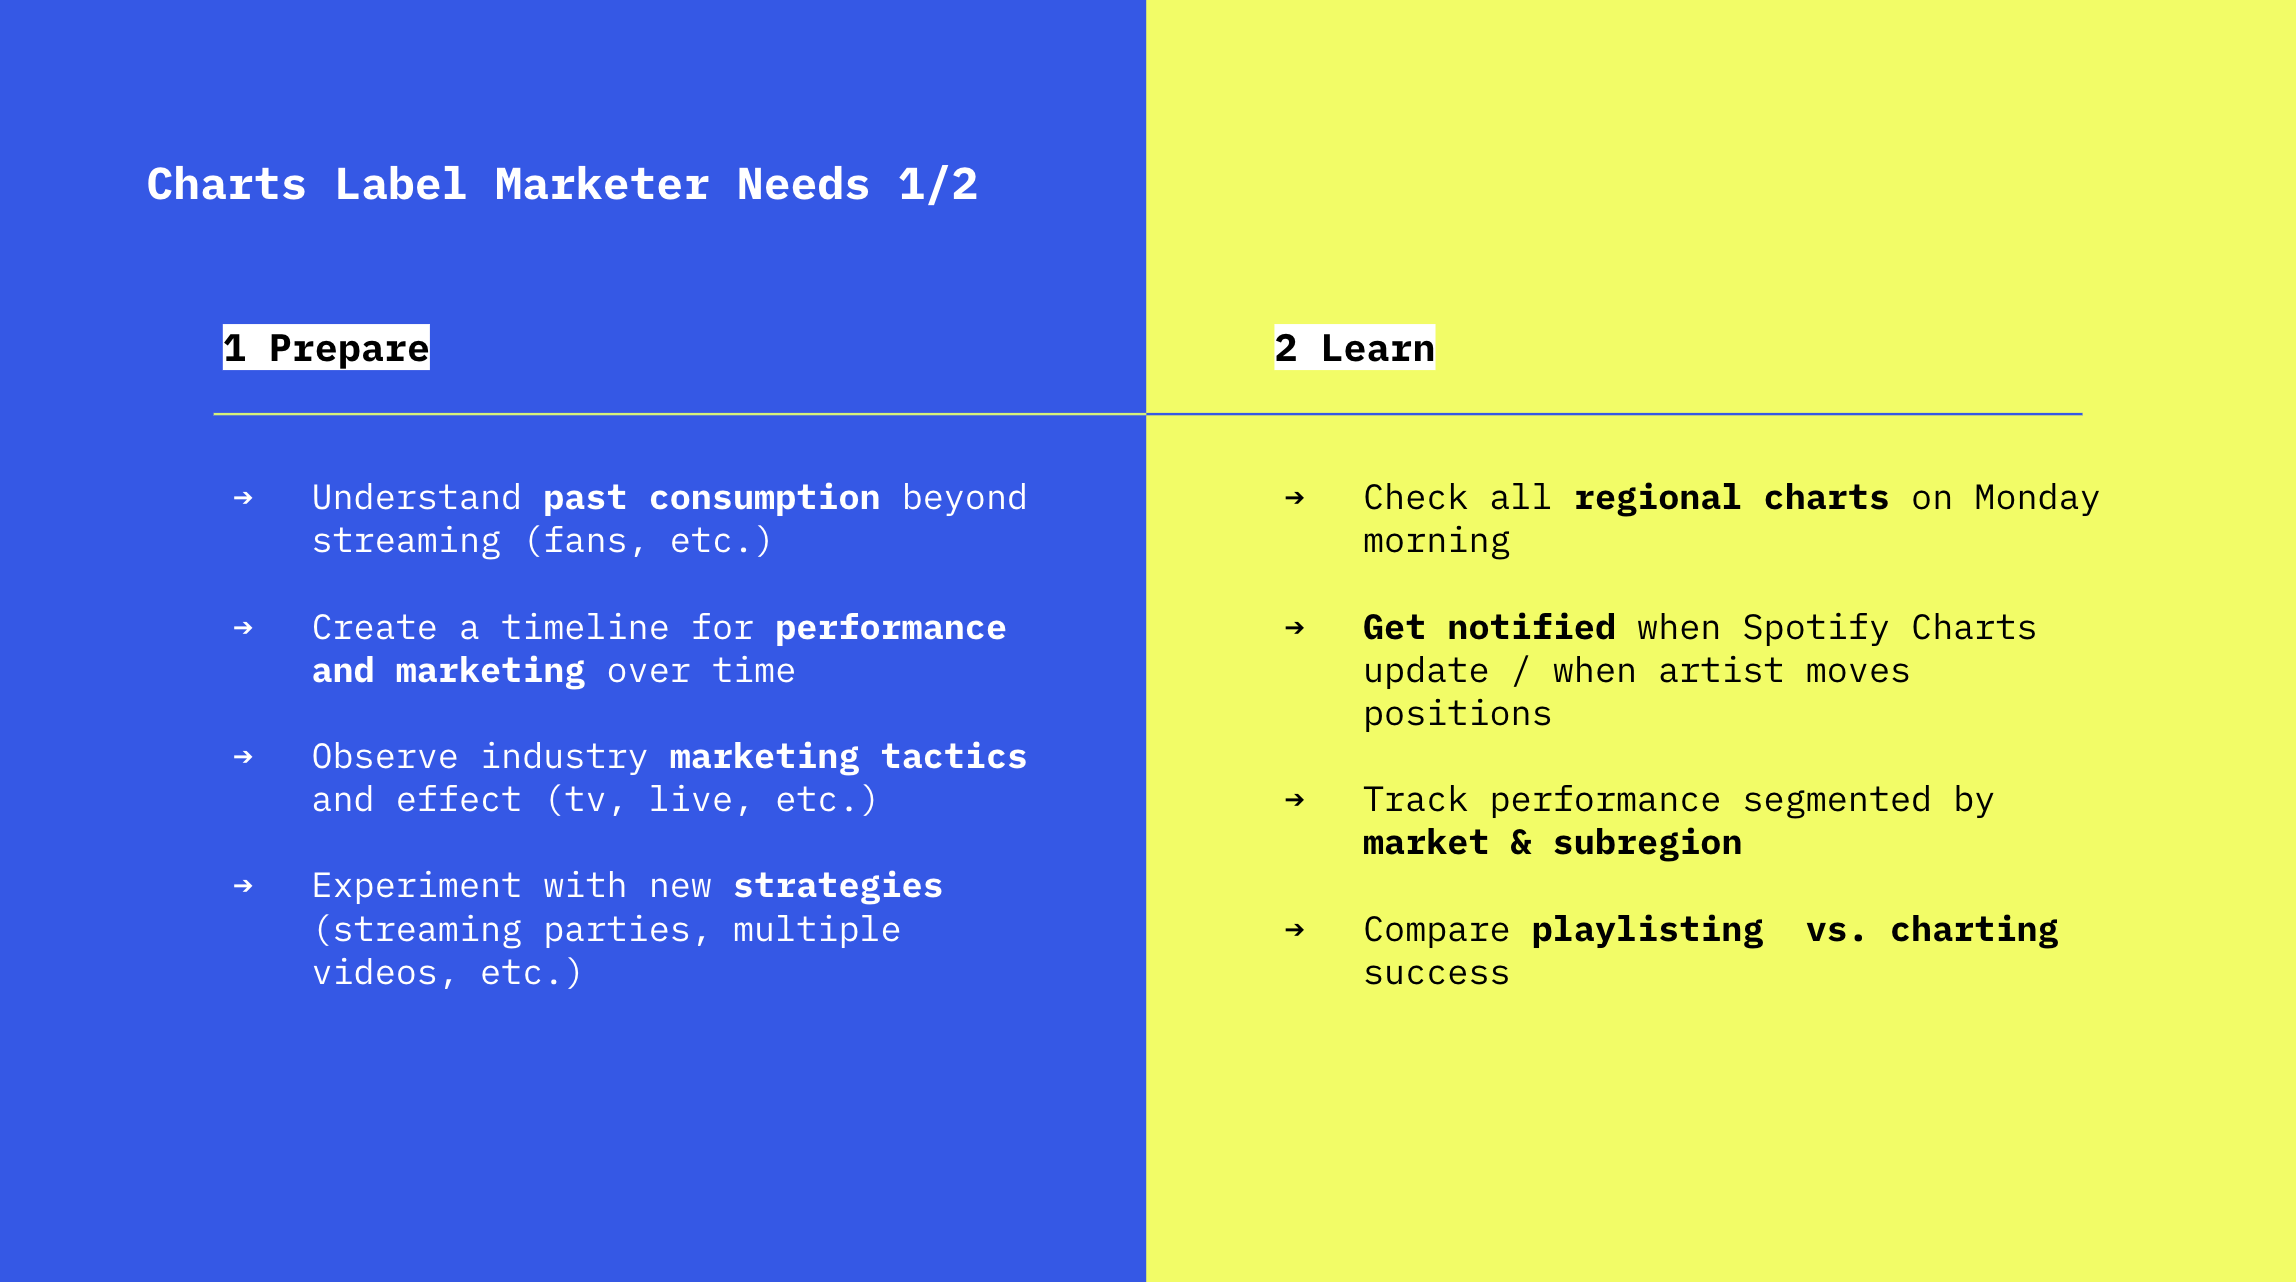
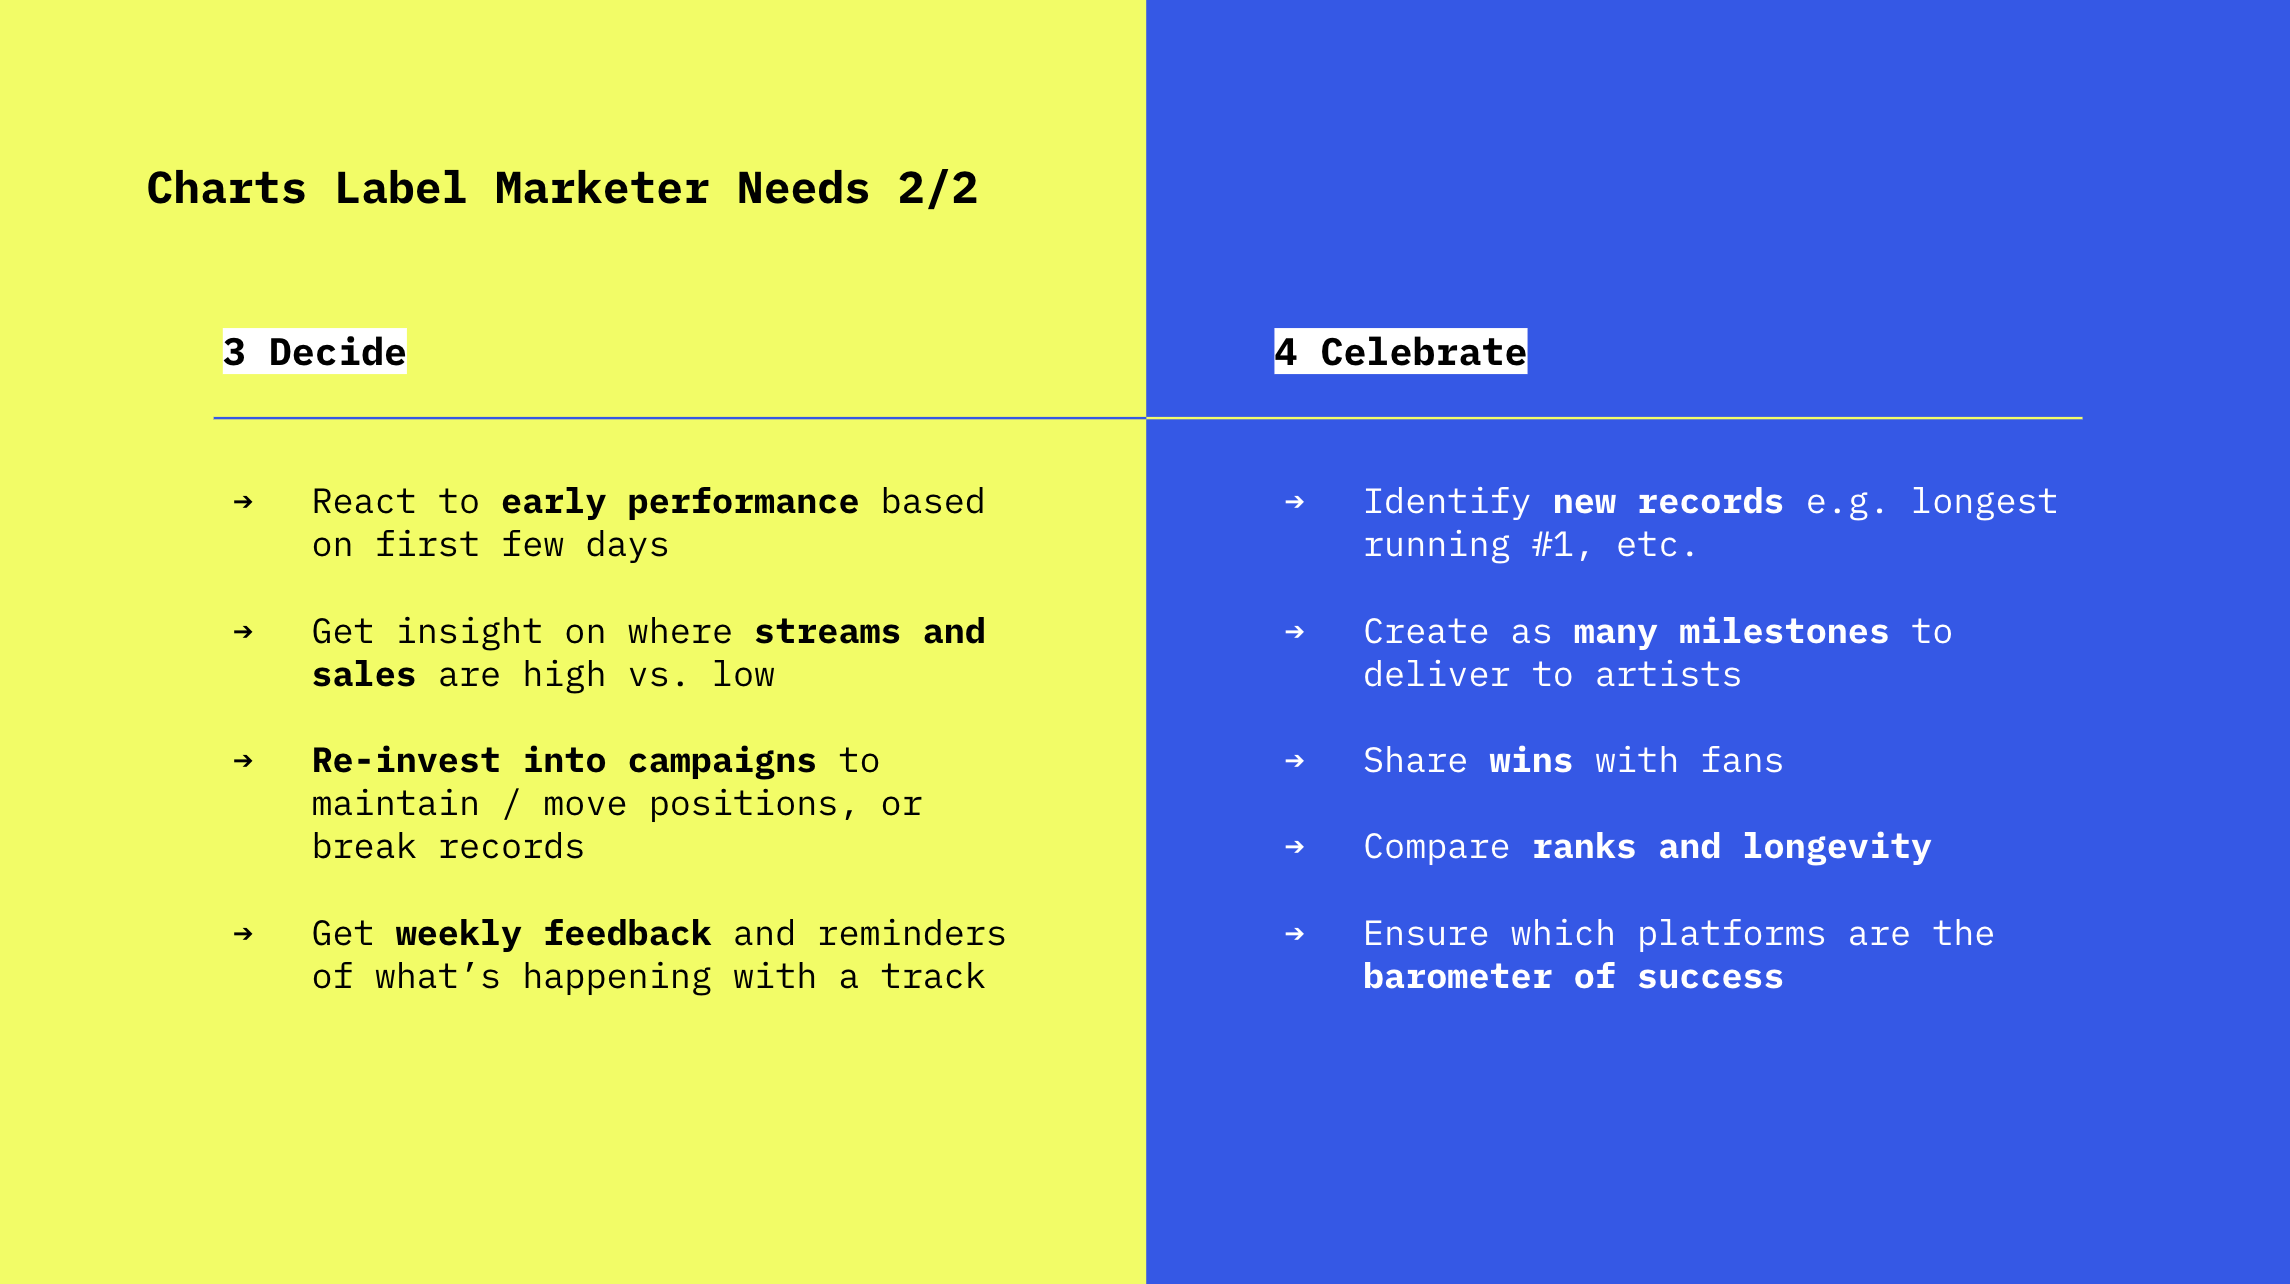
Identifying focus users and opportunities
We invited a panel of experts on the Music, Partnerships, and Programming side of the company to speak on behalf of the behaviors and JTBD of our target users (primarily the indie/major label marketer). This allowed us to build a charts user journey with needs across the release cycle.
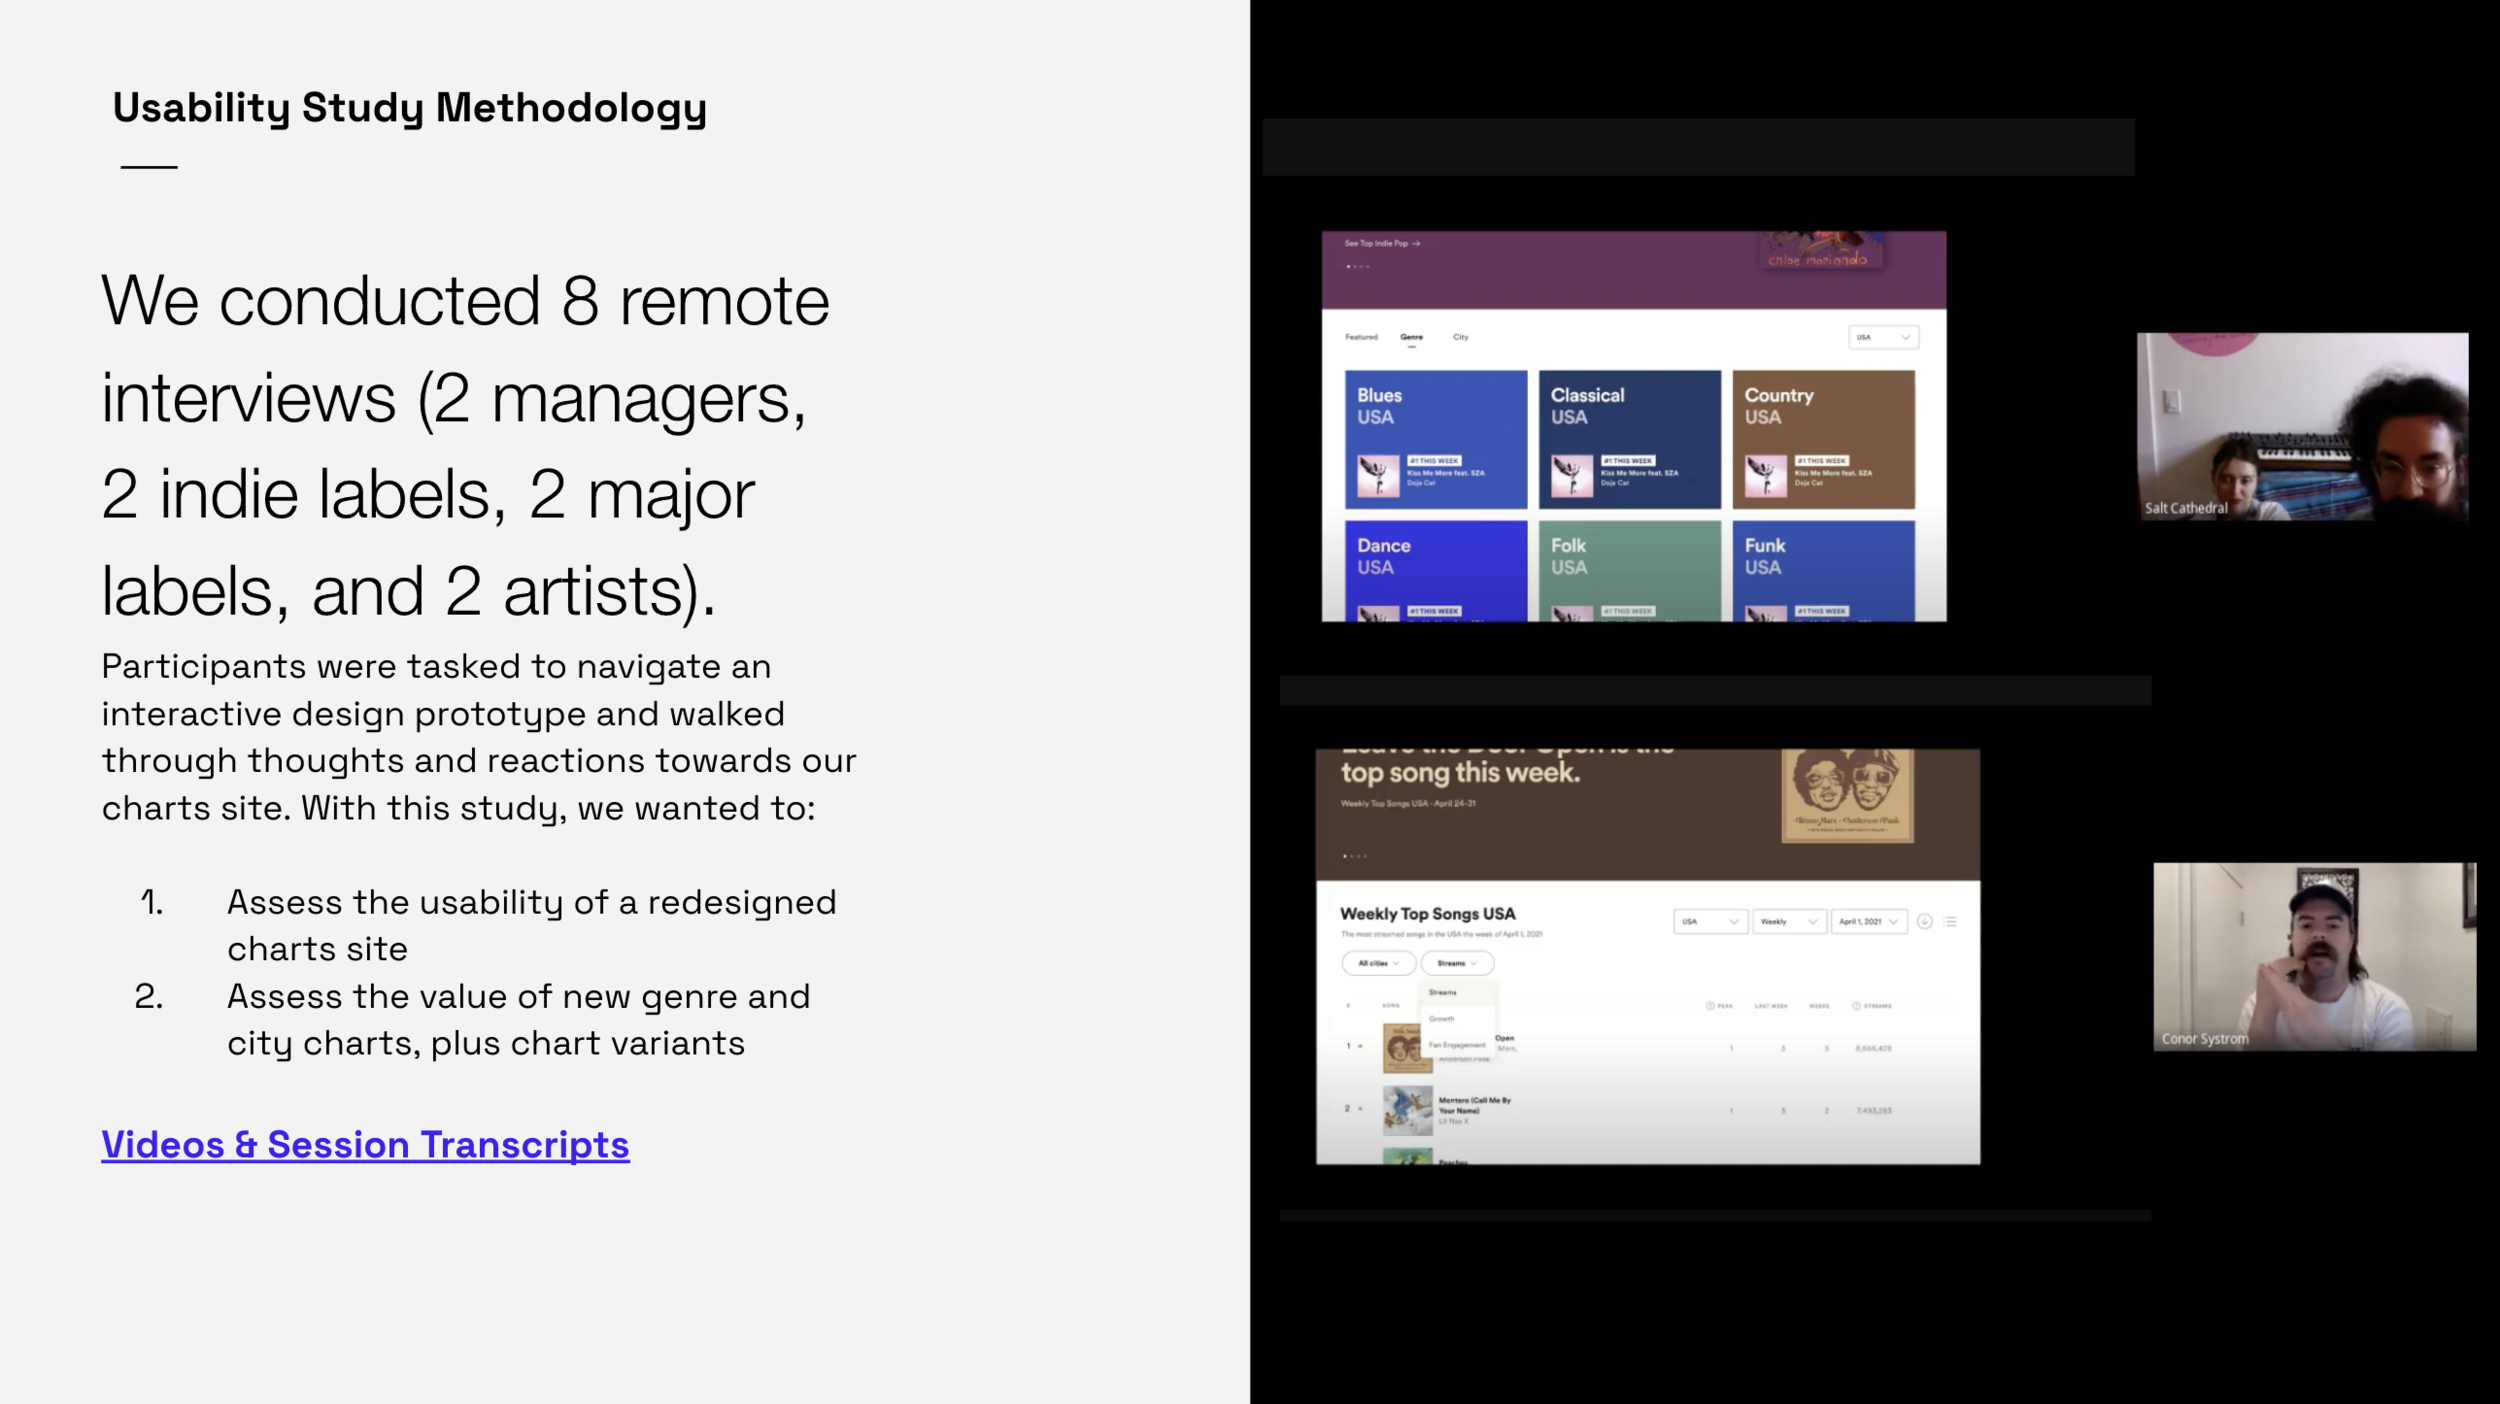
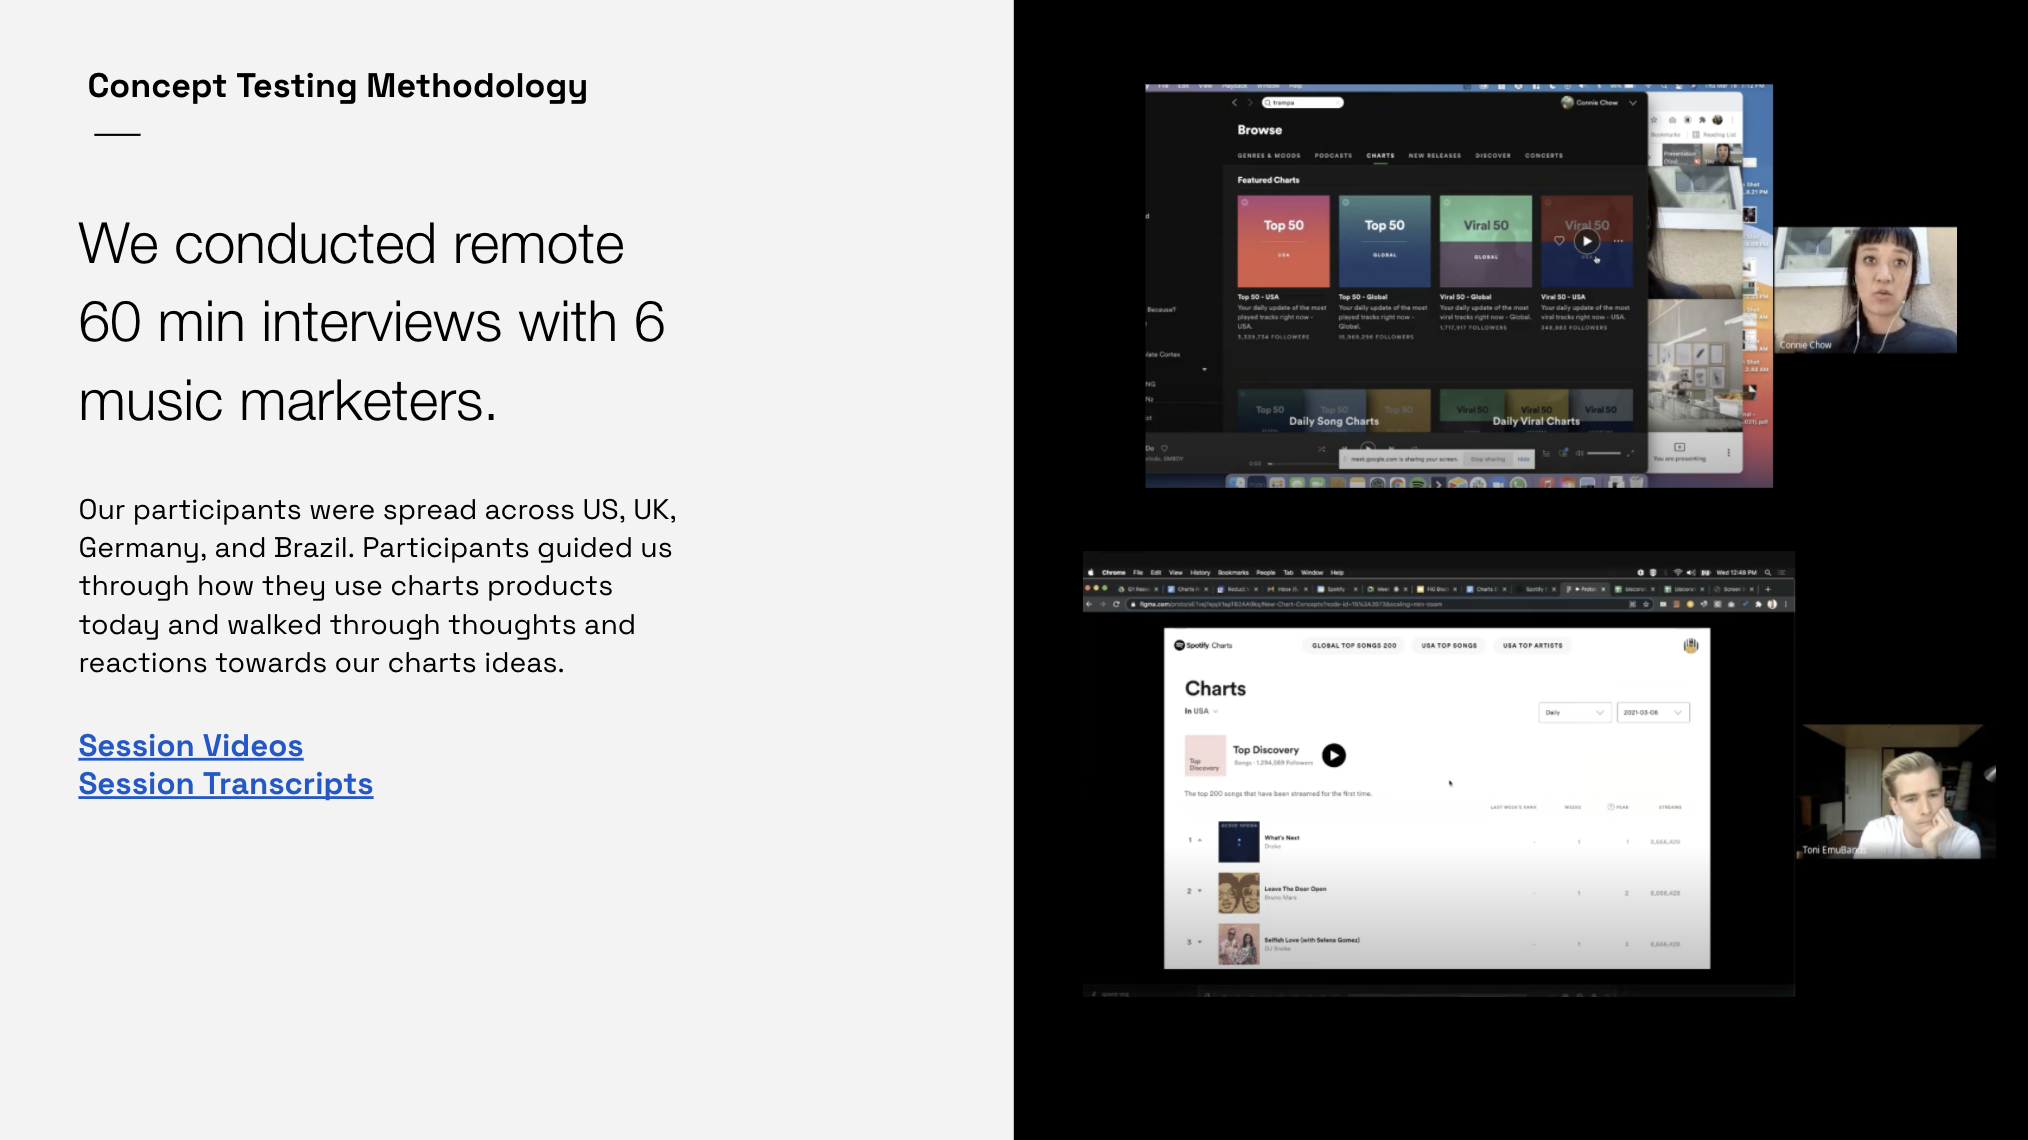
Discovery & Research
After discovery, we embarked on research aimed towards getting better confidence if we could improve product market fit with indies through charts. We ran 2 separate research sprints in Q2 focused on testing new chart concepts and usability via personalized prototypes. In addition, the squad drove internal interviews and surveys with internal music editors on new chart concepts. You can check out our reports here →
Project Phasing
After discovery, we moved into alpha and beta phases, across 3 complementary objectives. This phasing of work allowed us to be focused on the most critical pieces of the user experience, one chunk at a time, as we de-risked and slowly invited more features and users into the fold.
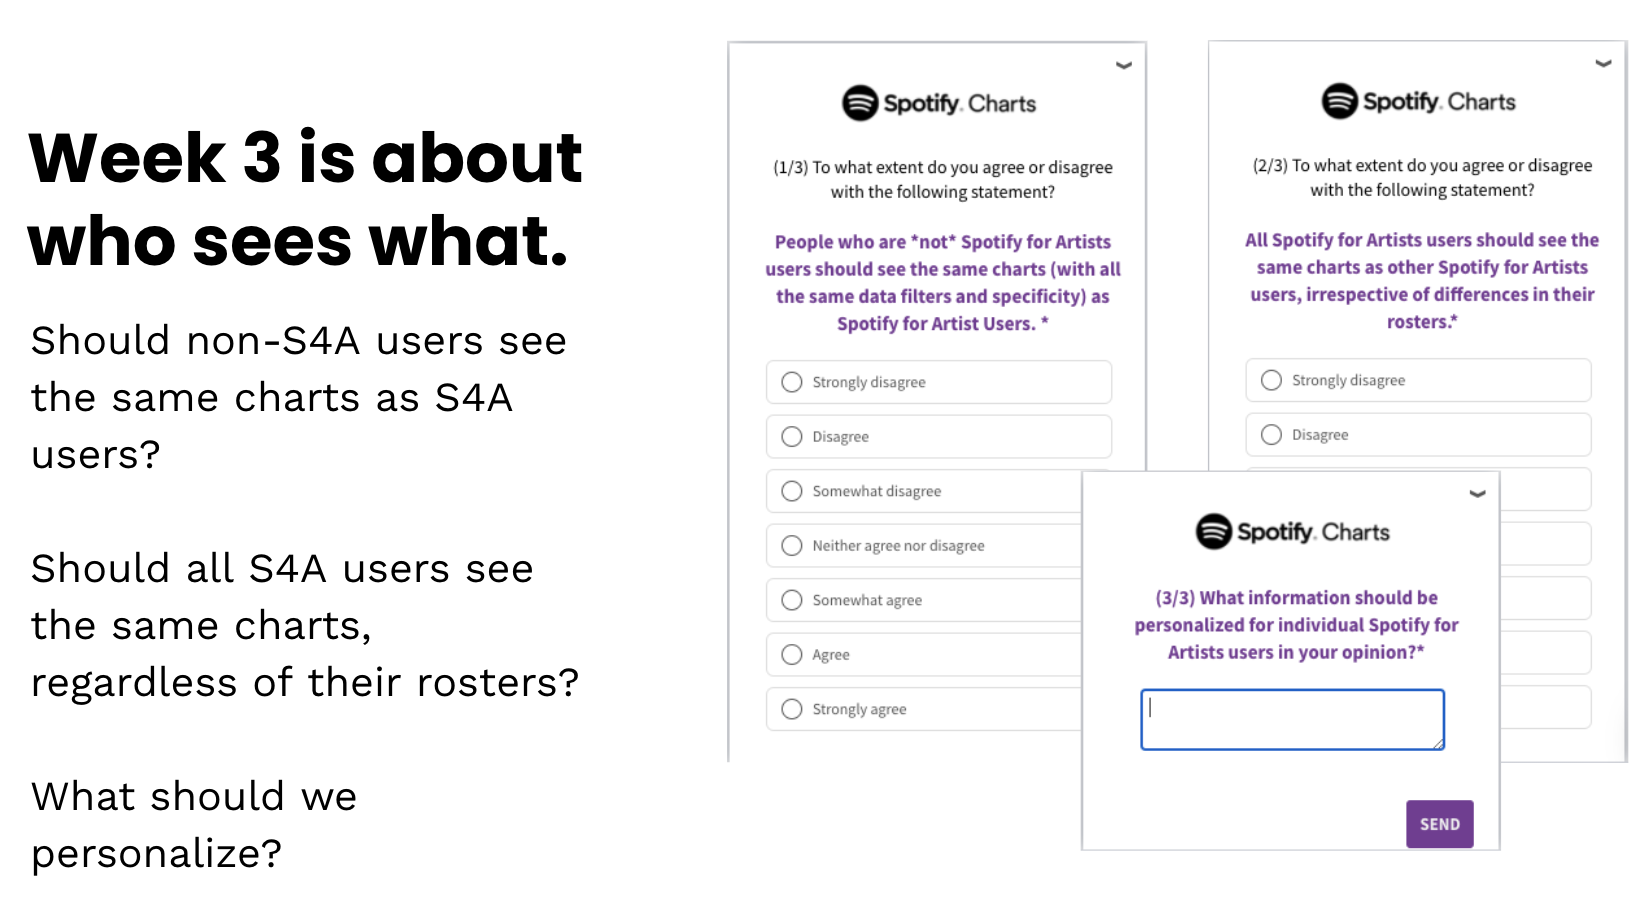
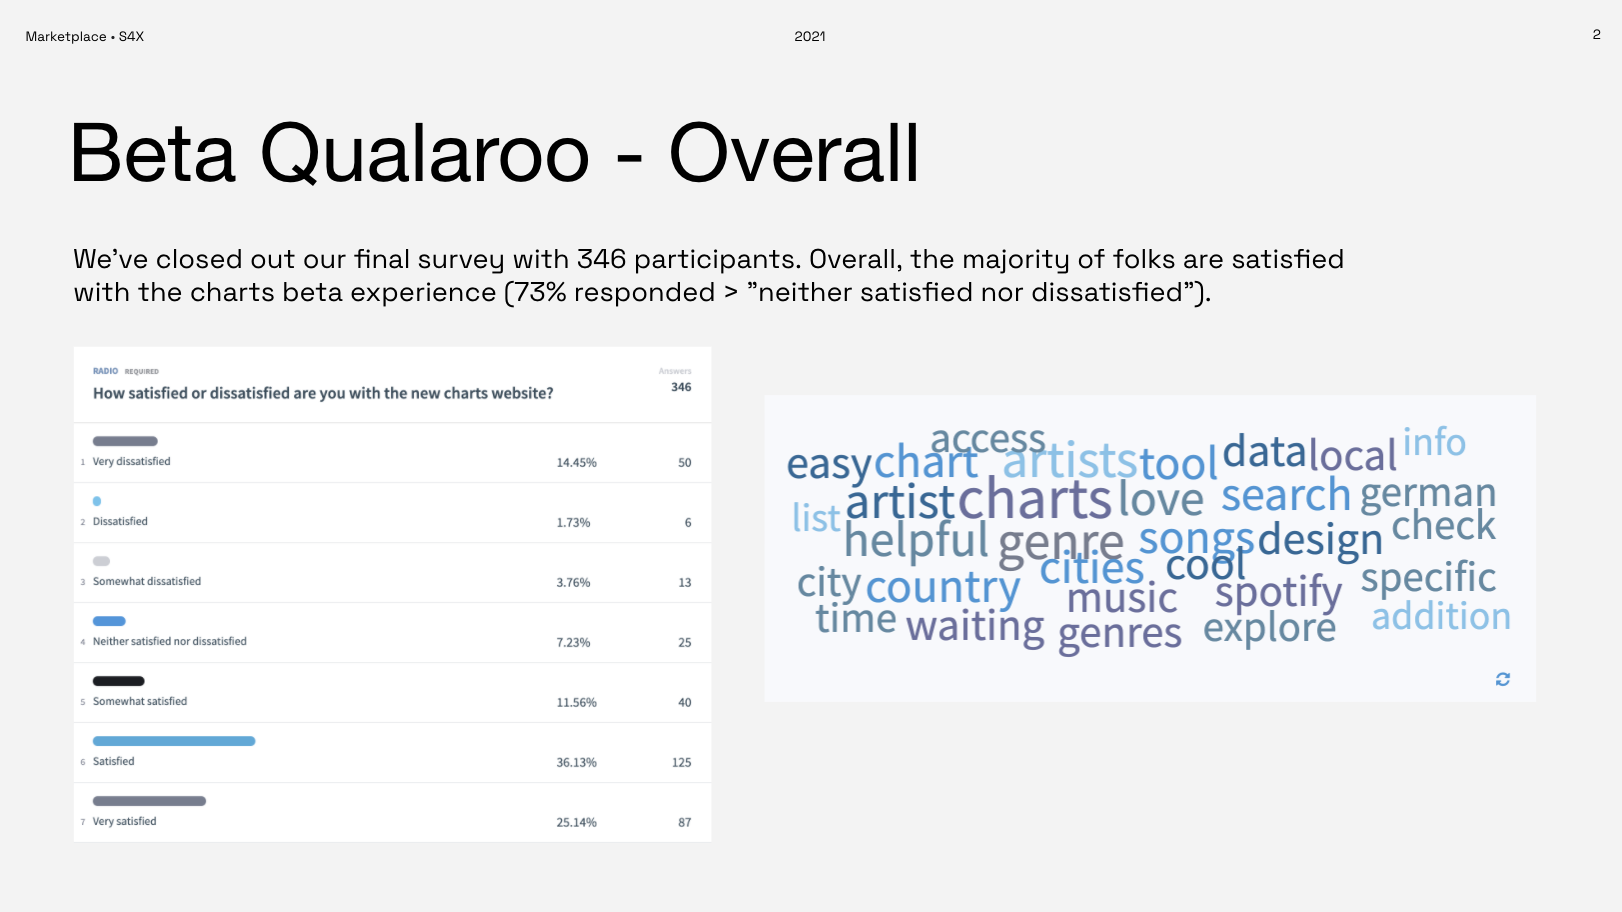
Throughout both the alpha and beta, we showed four distinct pop-up in product surveys (deployed through Qualaroo) to capture product feedback to incorporate into the GTM launch.
Go to Market
We launched the product in early November & worked closely with PMM and Art Direction to build announcement material in the form of videos, IG stories, home cards on Spotify for Artists and Spotify Charts channels.